At Apollo, 30+ engineering squads ship features daily. Speed was never the problem - coverage was. Every untested file was a silent risk, and our safety net was shrinking every week.
You can't improve what you can't measure. You can't enforce what isn't visible. And you can't sustain what isn't cultural.
We'd seen the mandate approach fail - engineers writing meaningless tests to game numbers, test suites validating incorrect behavior, coverage becoming a checkbox rather than a quality signal. So we went the other way: culture alongside compliance, visibility over mandates, opt-in adoption over top-down enforcement.
Today, our coverage has improved by 50% - not because we chased 100%, but because we built infrastructure that makes testing visible, accessible, and part of the workflow. Here's how we did it, what worked, and what we learned.
🎯 Why Test Coverage Matters
Quality is one of the hardest things to measure in engineering. Bug counts are lagging indicators. Incident rates are reactive. Code review quality is subjective. So when you're running a platform used by go-to-market teams worldwide with dozens of teams shipping daily, how do you know if your codebase is getting more resilient or more fragile?
Test coverage isn't a perfect metric, but it answers a question nothing else does: which parts of your codebase have zero safety net? No alert, no failing spec, nothing to catch a regression when someone touches an untested file. When we finally looked at ours, the picture wasn't pretty - frontend unit test coverage at Apollo was 24%, and falling.
📊 What We Track
We track coverage at two levels: overall platform coverage and team-specific coverage - so each squad sees exactly how their code is covered, not just a company-wide average.
The metrics break down into:
- Frontend
- Unit tests - using Vitest - a fast unit testing framework for Vite-based projects.
- End-to-end tests - using Playwright - browser automation for real user flows.
- End-to-end tests (Chrome extension) - using WebdriverIO - automation for our Chrome extension user flows.
- Backend - RSpec coverage.
- Coverage Delta (pts) - change over a given period (weekly, monthly, or per sprint)
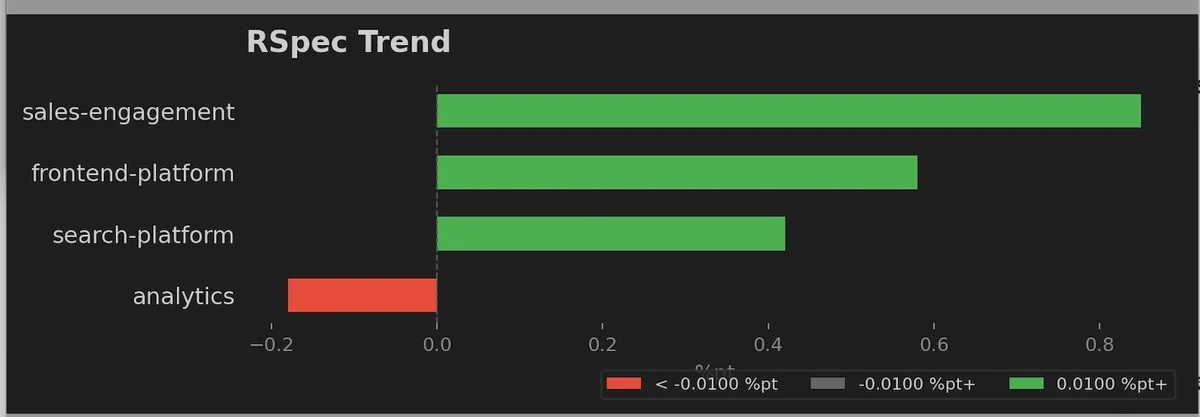
The delta is the one we watch most closely. A team at 35% trending upward is in better shape than a team at 55% that dropped 4 points. Direction matters more than position.
🛠️ How We Track It
Nightly CI runs generate coverage reports using V8 for Vitest, Istanbul/NYC for Playwright, and SimpleCov for RSpec.
Using CODEOWNERS, we map every file to the team that owns it. Metrics are pushed to Grafana via Prometheus, giving every team their own view - no manual categorization needed
On every PR, we check unit test coverage for newly added files and post a comment flagging any new code without tests. E2E coverage runs on demand. The goal is simple: no new file should land without visibility into whether it's tested.
const codeowners = new Codeowners(process.cwd(), 'CODEOWNERS');

for (const [filePath, coverageData] of Object.entries(coverageReport)) {
  let owners = codeowners.getOwner(relativeFilePath);
  owners.forEach((owner) => {
    // Aggregate coverage by owner
    coverageByCodeowner[owner].totalLines += coverageData.lines.total;
    coverageByCodeowner[owner].coveredLines += coverageData.lines.covered;
    // ... (functions, statements, branches)
  });
}
🖥️ The Grafana Dashboard: Making It Visible
The single biggest unlock wasn't a policy - it was a dashboard.
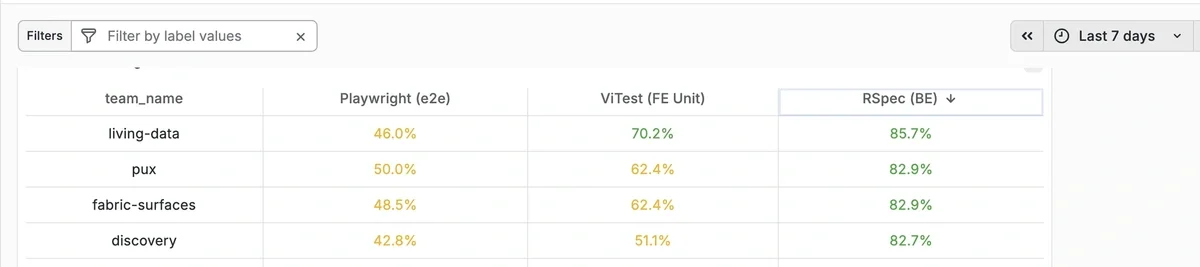
We built a unified Grafana dashboard fed by a nightly CI run against the latest master. Every morning, every team can see their frontend unit, frontend E2E, and backend coverage - broken down by team, compared to the previous week. Green means coverage improved. Red means it declined. The colors do the talking.
We review this on two cadences: weekly during quality reviews, where we call out declines and celebrate gains, and monthly during engineering metrics reviews for trend analysis and strategic planning. This regular rhythm keeps coverage top-of-mind without making it feel like an audit.
🔍 The Missing Coverage Report: Making It Actionable
A dashboard tells you where you stand. The missing coverage report tells you where to start.
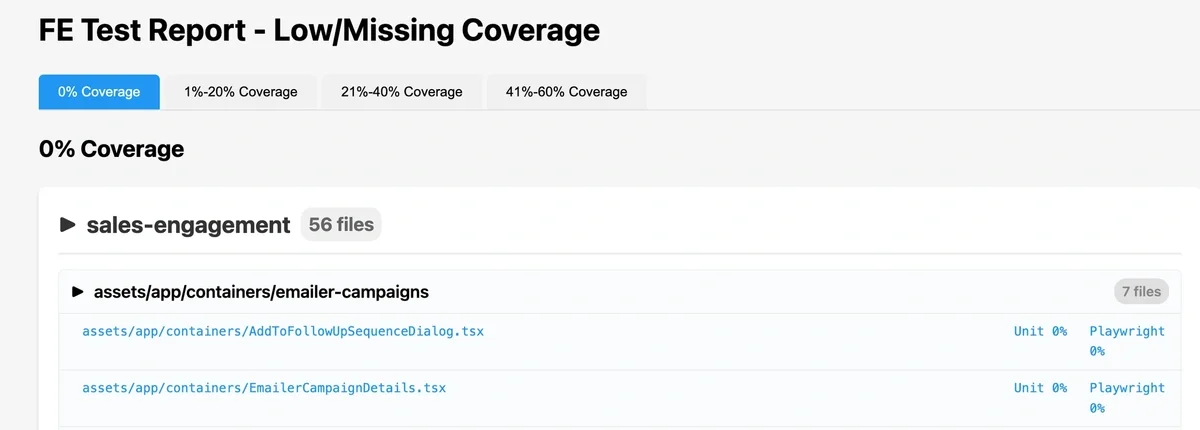
We generate a report that groups every file with zero coverage by team and directory, showing exactly which files have no unit tests, no E2E tests, or both. Engineers can filter by coverage range - 0%, 1-20%, 21-40% - and drill down to specific files and lines.
"Your team is at 45%" is abstract. "These 14 files in your design-system package have zero unit and zero Playwright coverage" is a starting point. Most team improvement efforts began here - pick the most critical uncovered files, write tests, repeat.
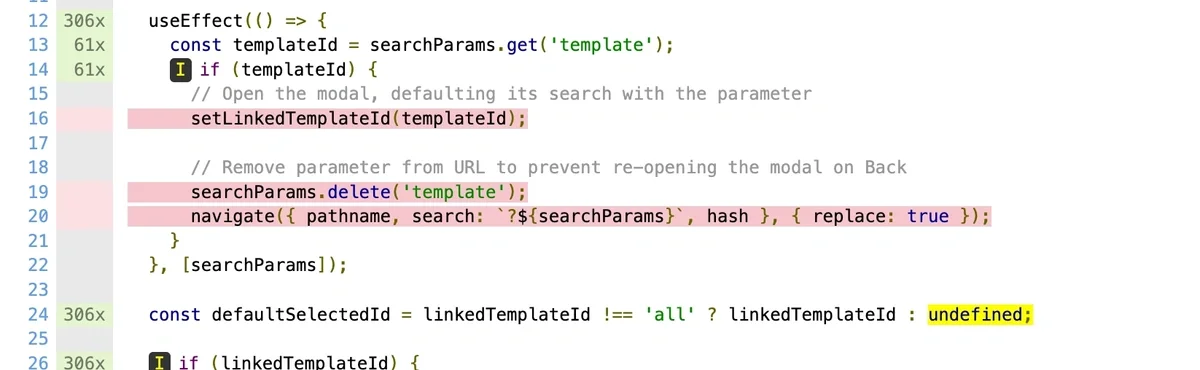
We also store detailed HTML reports on GCP. Engineers can drill into file-level, line-level coverage. "Lines 47-63 in EmailerCampaignDetails.tsx have zero coverage" helps a lot.
🚦 Catching Gaps at the PR Level
Dashboards show the big picture. The missing coverage report gives you a backlog. But we also needed something at the speed of a pull request.
We built a custom script - no paid tools, just TypeScript on top of the coverage JSON our test runners already produce - that posts a comment on every PR identifying new files with zero coverage, new files with partial coverage, and files where E2E tests provide coverage even without unit tests.
We deliberately accept E2E coverage as a valid signal. Some UI components are hard to test meaningfully with unit tests alone. We'd rather have an E2E test that validates real user behavior than a unit test that mocks everything away.
⛔ From Warnings to Blocking PRs
We didn't start with enforcement. We started with visibility and let the data do the convincing.
- Phase 0 - Built coverage calculation for all our test frameworks.
- Phase 1 - Added coverage comments to every PR. No blocking, just information. Awareness went up, but behavior change was slow.
- Phase 2 - Teams opt in by adding
fe_coverage_enforcement: truein their team config. PRs introducing new files with zero coverage get blocked to merge. - Phase 3 - Enforcement enabled for all teams ✅
- Phase 4 - Coverage checks for modified files (coming next)
Sample comment: When PR is blocked
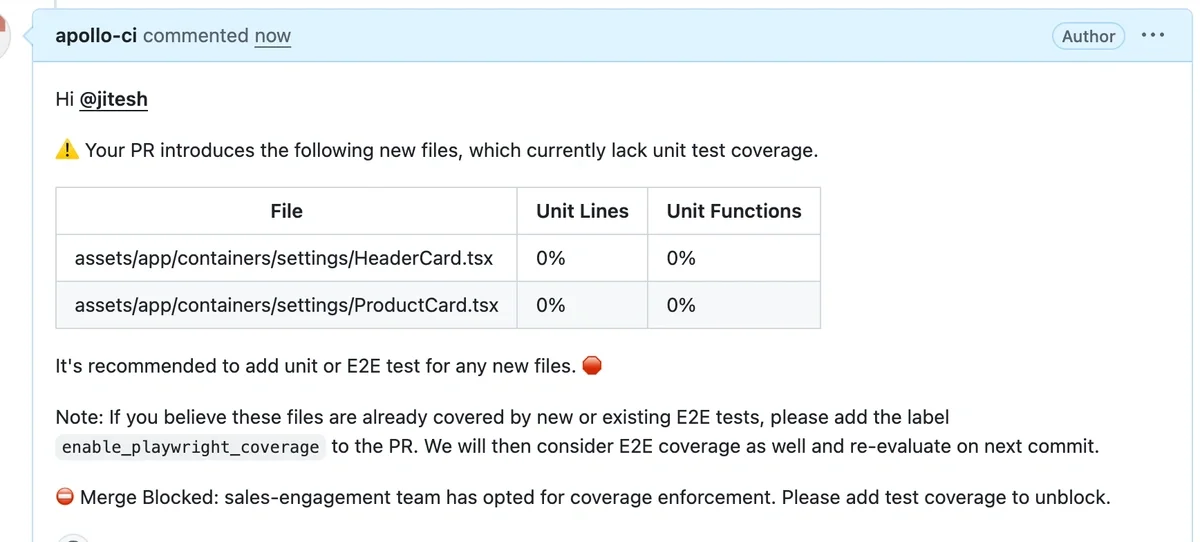
- Unblock
- When the coverage check blocks a PR, the author adds unit/E2E tests for the newly added file(s) and pushes an update. CI re-runs automatically, and once the check is green, the PR can be merged.
- Why this matters
- This makes missing tests an automatic PR signal, so teams do not rely on reviewers to notice and ask for tests before merge.
🛡️ P0 First: Not All Code Is Equal
The critical design choice: any coverage above 0% passes. Unit tests, Playwright - we don't prescribe which. Writing some test is infinitely better than writing none.
We tell teams: don't try to cover everything. Start with code that, if it broke, would directly impact users - payment flows, authentication, core workflow like search. Not every file/line needs a test, but critical paths should never ship uncovered.
🚪 Escape Hatches
For code that genuinely doesn't need testing, we have escape hatches - // code-coverage-ignore to exclude specific code, and a disable_coverage_enforcement label on PRs to unblock in urgent situations.
⏱️ Scaling Coverage Without Slowing CI
As coverage increases, CI can get slower and flakier. To keep running the full test suite on every commit, we invested in supporting CI tooling:
- Knapsack Pro to balance and parallelize test execution, keeping CI duration under control.
- Automated flaky-test reporting to continuously detect flaky tests , automatically create Jira tickets for the owning team, and drive quick fixes - so flakiness doesn’t become accepted noise.
- Automated slow-test reporting to proactively identify runtime regressions and enable quick action before CI performance degrades, including automatic Jira ticket creation for the owning team.
🧹 Dead Code Removal
One trick that helped more than expected: we gave teams the ability to identify dead code in their codebase. Removing unused files improved coverage instantly.
In one cleanup pass alone, teams removed 4,000+ lines of unused code and saw roughly a ~5% increase in test coverage.
For backend, we identify dead code using Tombstones by checking what never gets triggered in production over ~30 days. For frontend, we use Knip to detect unused files/exports.
🤖 AI as a Force Multiplier
Our coverage push coincided with our AI tooling rollout. Engineers used AI to generate test boilerplate and produce comprehensive suites faster.
To make this workflow consistent , we standardized:
- Skills + AI rules: reusable Vitest and Playwright workflows, guided by guardrails that enforce Apollo repo patterns and testing expectations so generated tests are closer to merge-ready.
- Best practices doc: a review checklist and guidelines to ensure AI-generated tests validate real behavior and do not just chase line coverage.
AI lowered the activation energy for writing tests dramatically. But it's not a replacement for thoughtful testing - AI-generated tests still need human review to ensure they validate real behavior, not just achieve line coverage.
🤝 No Magic Number: No Threshold
This was the most debated decision we made.
We have no minimum coverage threshold. Not 80%. Not 50%. Not even 30%. We've seen what threshold-driven cultures produce - engineers writing tests to satisfy a number rather than to protect behavior. Coverage becomes a game to win instead of a quality signal to trust.
We categorized teams into three tiers to frame conversations, not to gatekeep:
| Category | Coverage Range | What It Means |
|---|---|---|
| 🟢 Healthy | >70% | Maintain and celebrate |
| 🟡 Satisfactory | 40-70% | Room to grow, not a fire |
| 🔴 Needs Attention | <40% | Let's talk about what's blocking you |
📅 Keeping It Alive: The Weekly Rhythm
Tools and dashboards only work if someone's looking at them. During our bi-weekly quality review, we go through every team - red means declining, green means improving. We call out declines, celebrate gains, and identify specific files or components that need attention. Monthly, during engineering metrics reviews, we zoom out for trend analysis and strategic planning.
The rhythm matters more than the rules. Coverage stays top-of-mind not because it's enforced, but because it's talked about - regularly, publicly, and without blame.
🏆 The Results: Coverage as a Leading Indicator
Here's where we landed after six months:
| Metric | Before | After |
|---|---|---|
| FE Unit Test Coverage | ~24% | ~50% |
| Teams with Declining Coverage | 60% | 8% |
| Teams Opted Into Enforcement | 0 | All |
| PRs Blocked for Coverage | 0 | ~10/week |
⭐ Cultural shift: teams moved from 0 opt-ins to every squad opting into coverage enforcement - everyone is in on it and working toward it now.
The numbers matter, but what they represent matters more. Coverage went from something nobody tracked to something teams talk about in weekly reviews, PR comments, and sprint planning.
✨ Impact
- Impact on Product Quality
- ~35% reduction in high-severity (Sev-0/Sev-1) production incidents over the last 1 year, reflecting fewer customer-impacting regressions from recent changes.
- Engineering Efficiency
- Faster PR review because coverage gaps are highlighted automatically
- More confidence shipping changes (especially in high-risk areas)
💡 What We Learned - Key Takeaways
- Visibility beats mandates. The dashboard and PR comments changed more behavior than any policy document ever could.
- Direction over position. We celebrate the delta, not the absolute number. A team trending up matters more than a team sitting high.
- Low friction, high adoption. Any coverage above 0%, unit or E2E, with escape hatches. Engineers felt supported, not punished.
- Weekly cadence is non-negotiable. Without regular reviews, dashboards become wallpaper.
- Start with P0. Focusing on critical paths first made the effort manageable and the impact real.
- AI accelerates everything. Using AI tooling for test generation lowered the activation energy dramatically.
- 🚀 What’s Coming Next - Add a new leading indicator: track coverage of critical user journeys so we know real end-to-end workflows are protected, not just lines of code!
🙏 Acknowledgments
This wasn't a solo effort. Thanks to every engineer who wrote tests, reviewed dashboards, and held each other accountable.
Thanks to our engineering managers for making coverage a priority within their teams.
Special thanks to Marcin Natanek for helping build the Grafana dashboards and Umang Galaiya for reviewing the coverage enforcement proposal document and PR, Also, special thanks to Tejas H N and Neil Ongkingco for driving the dead code removal initiative, and to the SDET team for ensuring CI stays fast and doesn’t become a bottleneck.
Huge thanks to our leaders Dzmitry Markovich, Aidan Li and Rachel Vilceus for the leadership buy-in that made this initiative possible.
Ultimately, this work wasn’t about raising a metric - it was about shipping a more reliable product and reducing the regressions customers feel.
We hope sharing our journey helps other teams facing the same challenge.