
What Is Sales Velocity? Definition, Formula, and How to Improve It
Sales velocity determines how quickly revenue flows through your pipeline. For SDRs chasing quota and RevOps leaders tracking forecasts, understanding this metric reveals which deals move fast and which stall. In 2026, velocity is no longer just about closing faster—it's about buyer consensus, pre-contact positioning, and removing friction at every stage. According to Outreach, opportunities closed within 50 days have a 47% win rate, compared to 20% or lower after that threshold (as of September 2025). Speed and quality now go hand in hand.
Skip Manual Research - Apollo Finds Contacts
Tired of spending 4+ hours daily hunting for contact info? Apollo delivers 224M+ verified contacts with 96% email accuracy. Join 550K+ companies closing more deals.
Start Free with Apollo →Key Takeaways
- Sales velocity measures revenue flow rate: (# opportunities × win rate × deal size) ÷ cycle length
- Deals closed in under 50 days win at 2x the rate of longer cycles, making velocity a quality metric
- Buyer committees now include 6-10 decision-makers, requiring consensus assets to maintain momentum
- Pre-contact positioning shapes 95% of vendor shortlists before sales engagement begins
- Optimizing any single lever (opportunities, win rate, deal size, or cycle time) directly increases velocity
What Is Sales Velocity?
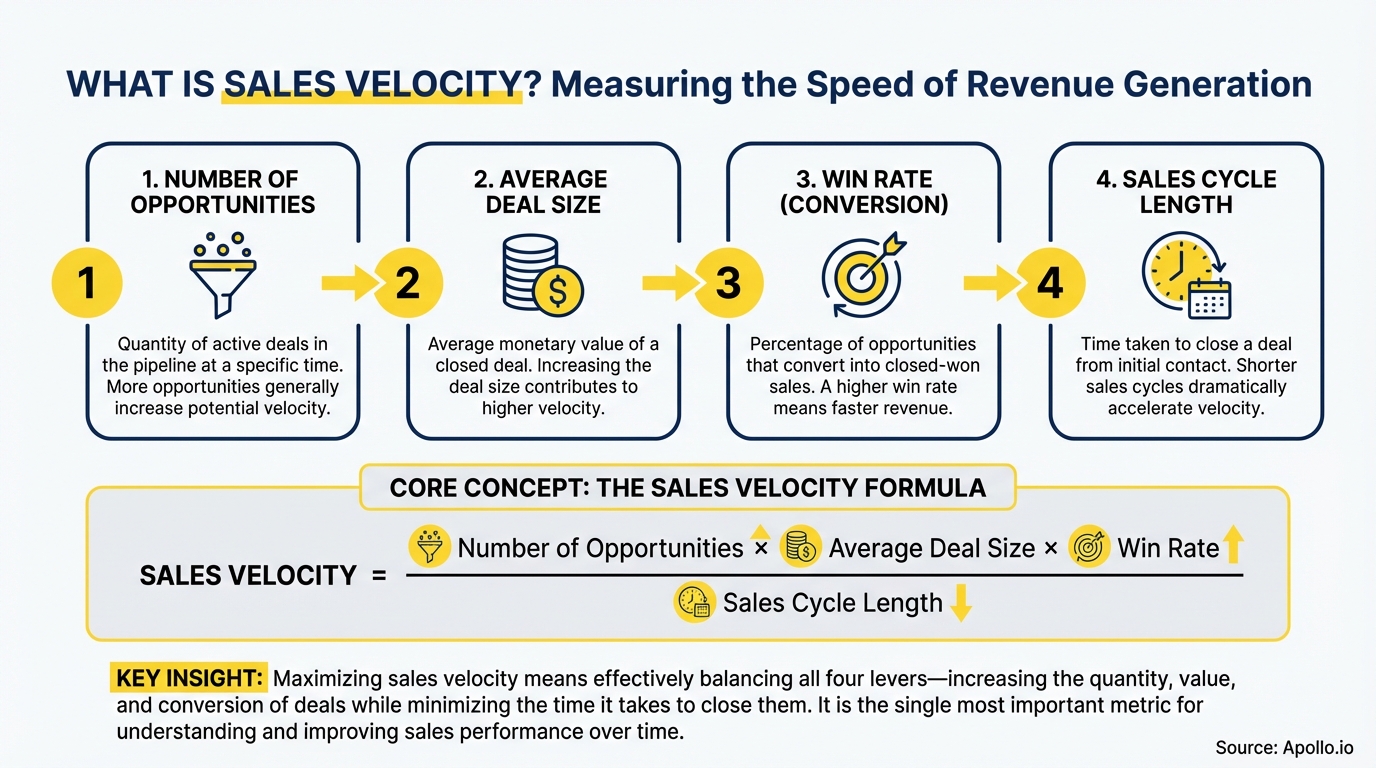
Sales velocity is the rate at which revenue moves through your pipeline. It combines four core inputs: number of opportunities, win rate, average deal size, and sales cycle length.
The formula is straightforward: multiply opportunities by win rate and average deal value, then divide by cycle length in days. This gives you revenue per day—the actual speed of your pipeline.
Research from Rachel A. Krug confirms that sales velocity has no universal benchmark as it depends on factors like prices, deal size, win rate, and sales cycle length; the goal is typically to improve your own velocity over time. Your baseline becomes your benchmark. Track it monthly to spot trends and identify which lever needs attention.
For AEs managing high-ticket sales, velocity reveals whether deals are progressing or stalling. For Sales Leaders overseeing teams, it shows where coaching and process changes deliver the highest ROI. In 2026, velocity is shifting from a rep KPI to a buyer-system metric—reflecting how well you enable consensus, not just how hard reps push.
Why Does Sales Velocity Matter in 2026?
Sales velocity directly impacts revenue predictability and growth. When velocity increases, you generate more revenue with the same pipeline volume. When it drops, forecasts miss even if top-of-funnel activity stays strong. According to Sproutworth, average revenue growth across B2B organizations reached 19% in 2024, up from 11% in the previous year, partly attributed to increased sales velocity.
Three factors make velocity critical today:
- Buying committees are larger:Abacum reports that the average B2B SaaS sales cycle increased by 18% to 134 days, reflecting increasingly complex buying processes with 6-10 decision-makers per deal (as of August 2025). More stakeholders mean more friction points.
- Pre-contact positioning is decisive: 95% of buyers purchase from their Day One shortlist. If you're not on it before first contact, velocity becomes irrelevant—you've already lost.
- Cycle time correlates with win rate: Deals that close in under 50 days win at 47%, while longer cycles drop to 20% or lower. Faster progression isn't just efficient—it's predictive of success.
RevOps teams use velocity to diagnose pipeline health. A dropping number signals trouble before revenue dips.
SDRs and BDRs see velocity as a leading indicator: if qualified opportunities stall in discovery, it's time to revisit qualification criteria or enablement assets. Velocity makes problems visible early.
How Do You Calculate Sales Velocity?
The sales velocity formula is: (Number of Opportunities × Win Rate × Average Deal Size) ÷ Sales Cycle Length (in days). This gives you revenue per day.
For example: 40 opportunities × 25% win rate × $15,000 average deal = $150,000. Divide by 90-day cycle = $1,667/day velocity.
Here's how each input affects the outcome:
| Input | What It Measures | How to Improve It |
|---|---|---|
| Opportunities | Pipeline volume | Increase prospecting, improve lead qualification, expand ICP |
| Win Rate | Conversion efficiency | Better discovery, tighter qualification, consensus enablement |
| Average Deal Size | Deal value | Upsell, cross-sell, target higher-value segments |
| Cycle Length | Time to close | Remove stage blockers, streamline approvals, enable buying groups |
Most teams track velocity by segment (SMB, mid-market, enterprise) because cycle length and deal size vary widely. The Digital Bloom notes that mid-market SaaS companies (100-999 employees) experience 3-4 month (60-120 days) sales cycles. Segment-level tracking reveals where velocity is strong and where it's dragging.
Struggling to track pipeline metrics across your team? Get complete pipeline visibility with Apollo's deal management and analytics.
Turn Forecast Guesswork Into Revenue Certainty
Pipeline forecasting a guessing game? Apollo's real-time signals show you exactly which deals will close. Built-In boosted win rates 10% with Apollo's scoring and intelligence.
Start Free with Apollo →What Factors Slow Sales Velocity?
Three bottlenecks consistently drag velocity down: consensus friction, late-stage stalls, and qualification gaps. SalesOps found that 58% of B2B professionals reported their sales cycles had gotten longer over the past year across industries (as of October 2025). Longer cycles directly compress velocity—even if win rates hold steady.
Consensus friction is the biggest hidden killer. Buying committees now range from 6 to 10 stakeholders across functions (finance, IT, operations, legal).
When internal disagreement emerges, deals stall indefinitely. Gartner research shows that 74% of buyer teams exhibit unhealthy conflict during decisions.
Without consensus-building tools (exec one-pagers, ROI models, security packets), deals die in committee review.

Late-stage blockers include security reviews, legal redlines, and procurement negotiations. These stages often consume 30-40% of total cycle time.
RevOps leaders see this pattern: deals move smoothly through discovery and demo, then hit a wall at contract review. Proactive enablement (pre-approved terms, security documentation, implementation timelines) removes these friction points before they stall momentum.
Qualification gaps create false velocity. SDRs book meetings with contacts who lack budget authority or decision-making power.
These "opportunities" inflate pipeline volume but never convert, dragging down win rate and extending cycle length. Tighter qualification criteria—verified budget, confirmed timeline, identified stakeholders—prevent low-quality deals from entering the pipeline.
Better to have fewer opportunities with higher win rates than inflated volume that stalls.
How Do Sales Leaders Improve Velocity?
Improving velocity means optimizing at least one of the four formula inputs. The highest-leverage moves depend on where your pipeline is weakest.
Sales Leaders should start with a diagnostic: which input is furthest from benchmark? That's your starting point.
To increase opportunities, focus on prospecting efficiency and lead qualification. SDRs and BDRs need access to verified contact data and intent signals to book more qualified meetings. Sales analytics reveal which sources and messaging drive the highest conversion rates. Doubling down on what works scales pipeline volume without adding headcount.
To improve win rate, enable consensus across buyer committees. Create stakeholder-specific assets: CFO-focused ROI models, IT security documentation, operations implementation plans.
Multi-threading (engaging multiple stakeholders simultaneously) prevents single-point-of-failure risk. When one champion leaves or loses influence, deals with broad internal support survive.
AEs managing complex deals should map buying groups early and assign content to each role.
To shorten cycle length, remove stage-specific blockers.
According to First Page Sage, the optimal range for sales cycles appears to be 46-75 days, where companies maintain strong velocity while preserving deal value and conversion rates.
Identify which stage consumes the most time (often proposal or legal review), then redesign the process.
Mutual action plans with clear milestones and owners keep deals moving.
Pre-approved contract templates and expedited security reviews compress late-stage timelines.
Need to consolidate your tech stack and accelerate deal cycles? Build and manage your entire pipeline in Apollo's unified platform.
What Role Does Pre-Contact Content Play?
Pre-contact content now shapes 95% of vendor selection decisions. Buyers research independently, compare alternatives, and form shortlists before engaging sales.
If your content doesn't position you as a category leader during this phase, velocity becomes irrelevant—you won't get the meeting.
The shift is dramatic: buyers now initiate contact at 61% of the journey (down from 69% in 2024), about 6-7 weeks earlier. This compresses the window where sales conversations influence decisions.
Content must do the heavy lifting: define the problem, establish category criteria, build trust through proof, and demonstrate differentiation. Problem-framing content, third-party validation (case studies, analyst reports), and category POVs earn shortlist inclusion.
AI evaluation is accelerating this trend. 89% of purchases now include AI features, and 58% of buyers engage sellers earlier specifically to clarify AI capabilities, data privacy, and governance. Content that addresses these concerns (AI explainers, model-risk documentation, compliance certifications) removes blockers before they stall deals.
Marketing and Sales must collaborate on a pre-contact content library that answers technical, financial, and risk questions independently.

Omnichannel complexity adds another layer. Buyers use 10+ interaction channels and 11+ touchpoints during evaluation.
Content must be modular and reusable across formats: blog posts, comparison pages, calculators, demos, security docs, integration guides. A unified content architecture ensures consistency while enabling buyers to self-serve at their own pace.
How Should RevOps Teams Track Velocity?
RevOps teams should track velocity by segment, stage, and rep to diagnose where performance lags. Segment-level tracking (SMB, mid-market, enterprise) reveals whether cycle length or deal size is out of line with benchmarks.
Stage-level tracking identifies bottlenecks—discovery, demo, proposal, contract. Rep-level tracking shows who needs coaching and who has repeatable best practices to share.
Build a velocity dashboard with these components:
- Overall velocity: Total pipeline revenue ÷ total days in cycle
- Segment velocity: Separate calculations for each customer tier
- Stage duration: Average days spent in each pipeline stage
- Win rate by stage entry: Conversion rates from each stage to close
- Velocity trend: Month-over-month change to spot deterioration early
Leading indicators matter more than lagging ones. If cycle length increases by 10% while win rate holds steady, velocity will drop—but you'll see it in real time, not after the quarter closes. RevOps can intervene: identify the stage causing delays, interview reps to understand blockers, and deploy enablement to fix the issue. Tracking sales KPIs alongside velocity provides context for what's driving changes.
Velocity benchmarks vary by industry and deal size, but directional trends are universal. Martal Group reports that the average B2B sales process in 2024 was approximately 25% longer than it was five years prior. If your velocity is declining faster than industry averages, it signals internal process issues—not just market conditions. Use benchmarks to contextualize your performance, then focus on controllable inputs.
Accelerate Your Sales Velocity in 2026
Sales velocity is the clearest measure of pipeline health and revenue predictability. It combines opportunity volume, win rate, deal size, and cycle length into a single metric that reveals where your process is strong and where it's broken.
In 2026, velocity improvements come from enabling buyer consensus, removing late-stage friction, and positioning your solution before first contact.
The data is clear: deals that close within 50 days win at 2x the rate of longer cycles. Buying committees with 6-10 stakeholders require consensus-building content and multi-threaded engagement.
Pre-contact positioning shapes 95% of shortlists, making category-defining content a velocity driver—not just a marketing activity. RevOps teams that track velocity by segment and stage can diagnose problems early and intervene before forecasts miss.
Improving velocity means optimizing at least one input: increase qualified opportunities through better prospecting, improve win rates with tighter qualification and consensus enablement, grow deal size through upsells and premium tiers, or shorten cycle length by removing stage-specific blockers. The highest-leverage move depends on your current bottleneck.
Measure, diagnose, and act.
Ready to consolidate your sales tech stack and accelerate pipeline velocity? Apollo combines prospecting, engagement, data enrichment, and deal management in one platform. "We reduced the complexity of three tools into one," says Collin Stewart, Predictable Revenue. "Having everything in one system was a game changer," reports Cyera. Start free with Apollo and see how unified GTM execution improves every velocity input.
Prove ROI Fast With Real Pipeline Results
Budget approval stuck on unclear metrics? Apollo tracks every touchpoint to pipeline, showing exactly what drives revenue. Built-In increased win rates 10% and ACV 10% with Apollo's intelligence.
Start Free with Apollo →Don't miss these
Sales
Inbound vs Outbound Marketing: Which Strategy Wins?
Sales
What Is a Sales Funnel? The Non-Linear Revenue Framework for 2026
Sales
What Is a Go-to-Market Strategy? The 2026 GTM Playbook
See Apollo in action
We'd love to show how Apollo can help you sell better.
By submitting this form, you will receive information, tips, and promotions from Apollo. To learn more, see our Privacy Statement.
4.7/5 based on 9,015 reviews
