
Sales Process Flowchart: How to Map Your B2B Sales Journey
B2B buying has fundamentally changed. Gartner reports that the traditional linear sales process no longer exists. Buyers now engage in parallel, non-sequential activities across digital and human channels. Your sales process flowchart needs to reflect this reality, not the outdated funnel model from 2015. This guide shows you how to build adaptive flowcharts that map real buyer behavior, integrate AI decision points, and help your team navigate modern B2B sales processes in 2026.
Apollo Finds Quality Leads 3x Faster
Tired of slow lead generation killing your pipeline? Apollo's AI identifies your exact ICP from 224M contacts with 96% accuracy. Join 550K+ companies scaling outreach.
Start Free with Apollo →Key Takeaways
- Traditional linear flowcharts fail because 61% of buyers prefer self-service paths that don't follow sequential steps
- Adaptive flowcharts map parallel buyer activities and decision points where AI assists human judgment
- 74% of buyer teams experience conflict during decisions, requiring consensus-building checkpoints in your process map
- Unified platforms cut tech stack complexity and provide single-source visibility across non-linear journeys
- Data-driven flowcharts with clear KPIs help sales leaders coach teams and forecast accurately
What Is a Sales Process Flowchart?
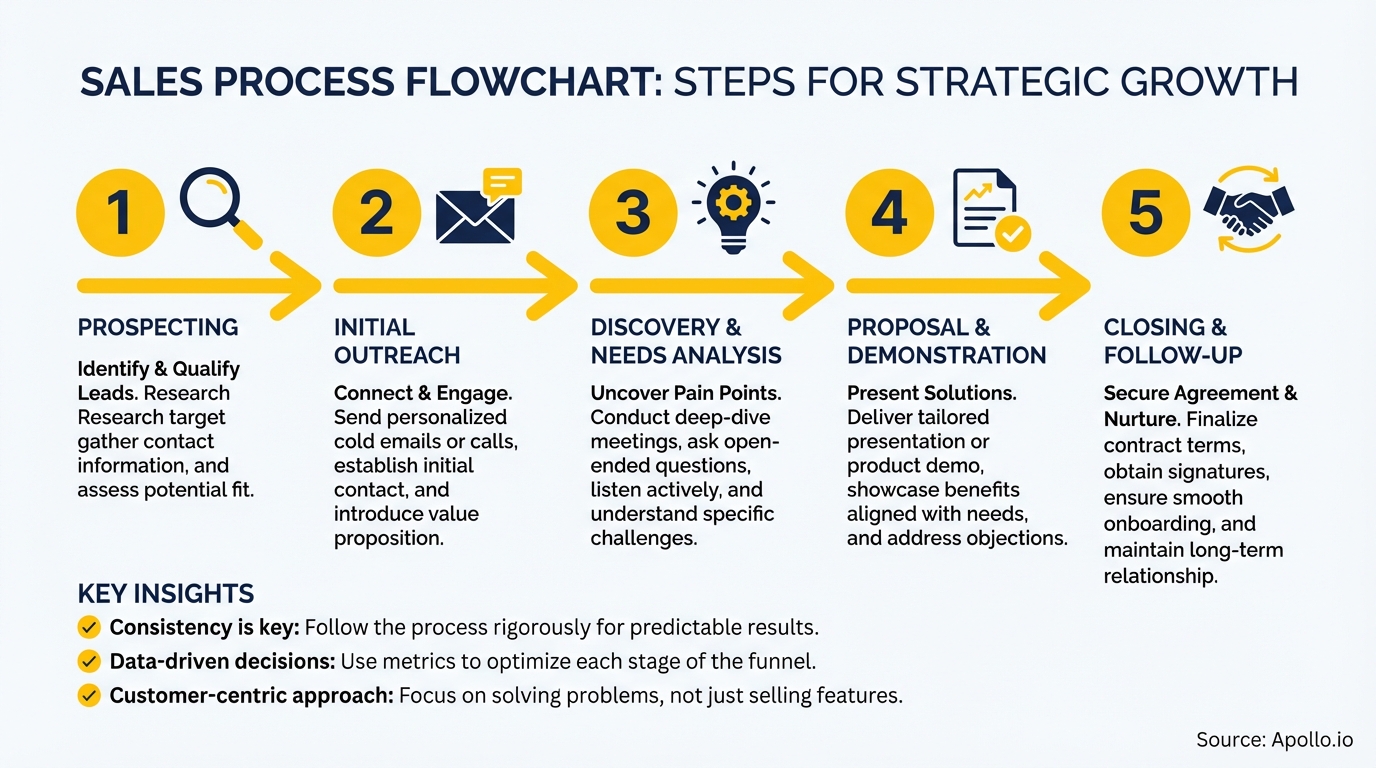
A sales process flowchart is a visual map showing how prospects move from initial contact to closed deal. It diagrams stages, decision points, activities, and handoffs across your sales motion.
Modern flowcharts in 2026 differ from legacy versions by accommodating non-linear buyer paths and integrating AI-assisted actions alongside human touchpoints.
The flowchart serves as your team's operational blueprint. SDRs use it to understand qualification handoffs. AEs reference it for deal stage requirements. RevOps leaders analyze it to identify bottlenecks and drop-off points in the sales funnel.
According to Gartner's 2025 research, 61% of B2B buyers prefer a rep-free experience. Your flowchart must map both seller-led and self-service paths, showing where buyers access content independently and where human interaction adds value.
Why Do Traditional Sales Flowcharts Fail in 2026?
Traditional flowcharts assume buyers move sequentially: awareness → consideration → decision → purchase. Real buyer behavior is messier.
Prospects research solutions while simultaneously evaluating vendors, conducting technical trials, and building internal consensus. They loop back to earlier stages, skip steps entirely, and engage multiple channels at once.
Three critical failures plague legacy flowcharts:
- Linear assumptions: They force non-linear journeys into artificial sequences
- Single-channel focus: They ignore that 80% of interactions now happen digitally
- Missing decision frameworks: They don't address the 74% of buyer teams experiencing unhealthy conflict during decisions
For Sales Leaders managing teams in 2026, outdated flowcharts create coaching gaps. Reps don't know when to engage versus when to let buyers self-serve. B2B sales processes need adaptive maps that reflect actual buyer movements and decision complexity.
How Do You Build an Adaptive Sales Process Flowchart?
Adaptive flowcharts map parallel paths and decision branches instead of forcing linear progression. Start by identifying core buyer activities, not seller stages.
Buyers research, evaluate, test, build consensus, and secure approval simultaneously across different stakeholders.
Core design principles:
| Principle | Implementation | Benefit |
|---|---|---|
| Multi-path design | Map 3-5 common buyer journeys with branch points | Accommodates different buying committee roles |
| Feedback loops | Add arrows showing regression to earlier stages | Reflects real behavior when buyers revisit decisions |
| Channel indicators | Label touchpoints as digital self-service or human-assisted | Clarifies when reps engage versus when buyers explore independently |
| Consensus checkpoints | Mark stages requiring stakeholder alignment | Prevents deals from stalling due to internal conflict |
Struggling to track deals across multiple paths? Manage complex pipelines with Apollo's unified deal tracking and cross-channel visibility.
What Are the Essential Stages in a Modern Flowchart?
Modern flowcharts organize around buyer objectives, not internal sales stages. Each stage should answer: "What is the buyer trying to accomplish?" rather than "What does the seller need to do?"
- Problem validation: Buyer confirms the problem is worth solving
- Solution exploration: Buyer researches potential approaches (often self-service)
- Vendor evaluation: Buyer compares specific providers and conducts demos
- Technical validation: Buyer tests product fit through trials or POCs
- Business case building: Champion secures budget and stakeholder buy-in
- Consensus formation: Decision committee aligns on selection criteria and vendor
- Procurement execution: Legal, security, and purchasing complete due diligence
For RevOps teams, these buyer-centric stages map cleanly to CRM opportunity stages while providing flexibility for non-linear movement.
How Do Sales Leaders Integrate AI Into Process Flowcharts?
AI integration in 2026 means augmenting human judgment, not replacing it. Research from Gartner predicts that 75% of B2B sales organizations now augment traditional playbooks with AI-guided solutions. Your flowchart should specify where AI provides recommendations and where humans make final decisions.
AI decision points to map:
- Lead qualification: AI scores leads based on fit and intent signals; SDRs decide whether to engage
- Outreach timing: AI suggests optimal contact windows; reps choose messaging approach
- Content recommendations: AI proposes relevant case studies based on prospect industry; AEs select materials
- Deal risk assessment: AI flags stalled opportunities; managers determine intervention strategy
- Next-best-action: AI suggests follow-up steps based on engagement patterns; reps execute with context
The key is clarity about boundaries. Your flowchart should show AI as an input to human decision nodes, not as autonomous action triggers. This maintains accountability while leveraging AI sales tools for efficiency.
Tired of manual lead scoring and guessing next steps? Let Apollo's AI prioritize accounts and suggest actions while your team focuses on closing.
Turn Forecasting Guesswork Into Revenue Certainty
Pipeline forecasting a guessing game? Apollo delivers real-time deal visibility across every stage so you can predict revenue with confidence. Built-In boosted win rates 10% with Apollo's intelligence.
Start Free with Apollo →How Do SDRs Use Flowcharts to Book More Meetings?
SDRs benefit from flowcharts that clarify qualification criteria and handoff requirements. The chart should answer: "What signals indicate a prospect is ready for AE engagement?" and "What information must I gather before scheduling a demo?"
Effective SDR flowcharts include:
- Qualification branches: Clear yes/no decision points for BANT or MEDDIC criteria
- Objection handling paths: Mapped responses for common blockers like "not interested" or "wrong timing"
- Multi-touch sequences: Visual representation of email, call, and social touchpoint cadences
- Handoff checklists: Required data points and discovery notes needed before passing to AEs
SDRs using unified platforms report higher meeting conversion because they access complete prospect context without toggling between tools. As one rep at Predictable Revenue noted: "We reduced the complexity of three tools into one."
What Metrics Should You Track in Your Sales Process Flowchart?
Data-driven flowcharts include KPIs at each stage transition. By 2026, 65% of sales organizations have transitioned from intuition-based to data-driven decision-making. Your flowchart should specify what to measure and acceptable thresholds.
| Stage Transition | Key Metric | Target Benchmark |
|---|---|---|
| Lead to qualified opportunity | Qualification rate | 15-25% (varies by ICP) |
| Qualified to demo scheduled | Meeting conversion rate | 40-60% for outbound |
| Demo to technical validation | Trial/POC activation rate | 30-50% depending on complexity |
| Technical validation to proposal | Success criteria achievement | 70%+ should meet defined outcomes |
| Proposal to closed-won | Close rate | 25-35% for qualified pipeline |
Sales Leaders should also track stage velocity (average days in each stage) and identify where deals stall. Flowcharts with embedded metrics become diagnostic tools, not just process documentation.
How Do You Implement Cross-Channel Consistency in Your Flowchart?
Cross-channel consistency means prospects receive coherent messaging whether they engage via email, phone, chat, or self-service portals. Your flowchart should map information governance rules that prevent contradictory messages across touchpoints.
Implementation checklist:
- Define single source of truth for customer data (typically your CRM or unified platform)
- Establish content libraries with approved messaging for each buyer stage
- Create notification triggers when prospects engage multiple channels simultaneously
- Map handoff protocols between SDRs, AEs, and customer success teams
- Document escalation paths when buyer questions exceed rep knowledge
For Founders and CEOs building scalable processes, tool consolidation is critical. Census reported: "We cut our costs in half" by moving from disparate systems to a unified GTM platform.
Fewer tools mean fewer integration points where information gets lost or contradicted.
What Templates and Tools Help Build Better Flowcharts?
Start with these proven frameworks:

- Swimlane diagrams: Show parallel activities across buyer roles (economic buyer, technical evaluator, end user)
- Decision tree format: Map if/then branches for qualification and objection handling
- RACI matrices: Clarify who is Responsible, Accountable, Consulted, Informed at each stage
- Kanban-style boards: Visualize deal flow with cards moving through columns
For Account Executives managing complex enterprise sales cycles, swimlane diagrams work best because they show how different stakeholders engage at different points. Technical buyers may enter during solution exploration, while procurement enters late-stage.
Digital tools that support adaptive flowcharts include process mapping software with version control, collaborative editing, and CRM integration. The goal is a living document that evolves based on win/loss analysis and changing buyer behavior.
Start Building Your Adaptive Sales Process Flowchart
Traditional linear flowcharts no longer match how B2B buyers actually make decisions in 2026. Your sales process map needs to accommodate parallel activities, self-service paths, AI-assisted decision points, and consensus-building checkpoints.
By mapping real buyer behavior instead of forcing prospects into rigid stages, you create a blueprint that helps SDRs qualify faster, AEs close more predictably, and Sales Leaders coach with data-driven insights.
The shift to adaptive flowcharts requires unified visibility across your entire GTM motion. As Cyera's team discovered: "Having everything in one system was a game changer." When your prospecting, engagement, deal tracking, and analytics live in separate tools, you lose the cross-channel consistency that modern buyers expect.
Ready to map your sales process with complete pipeline visibility and AI-guided insights? Start free with Apollo and build your adaptive sales flowchart on a platform that unites contact data, engagement tracking, and deal management in one workspace.
Prove Apollo's Value In Your First 30 Days
Budget approval stuck on unclear metrics? Apollo delivers measurable pipeline impact from day one—track every dollar generated. Built-In increased win rates 10% and ACV 10% with Apollo's intelligence.
Start Free with Apollo →Don't miss these
Sales
Inbound vs Outbound Marketing: Which Strategy Wins?
Sales
What Is a Sales Funnel? The Non-Linear Revenue Framework for 2026
Sales
What Is a Go-to-Market Strategy? The 2026 GTM Playbook
See Apollo in action
We'd love to show how Apollo can help you sell better.
By submitting this form, you will receive information, tips, and promotions from Apollo. To learn more, see our Privacy Statement.
4.7/5 based on 9,015 reviews
