
Sales Funnel Graphic: How to Visualize Modern B2B Buyer Journeys
Modern B2B buyers control their own research journey. They evaluate vendors, compare solutions, and form preferences before ever speaking to sales. Traditional linear sales funnel graphics no longer reflect this reality. Today's sales funnels must account for non-linear paths, multiple stakeholders, and self-service research loops that happen outside your visibility.
Stop Wasting Hours—Apollo Finds Leads Instantly
Tired of spending 4+ hours daily hunting for contact info? Apollo delivers 224M+ verified contacts with 96% email accuracy. Join 550K+ companies who turned research time into selling time.
Start Free with Apollo →Key Takeaways
- Modern sales funnel graphics must reflect non-linear, rep-free buyer journeys where prospects research independently
- Vendor preference forms early in 48% of B2B purchases, requiring preference-building content at the top of your funnel
- Buying groups average 13 decision-makers, making stakeholder alignment a critical funnel stage
- Only 34% of companies regularly optimize their funnel, creating opportunity for data-driven teams
- Apollo consolidates prospecting, engagement, and pipeline management into one workspace, eliminating the complexity of managing separate tools
What Is a Sales Funnel Graphic in 2026?
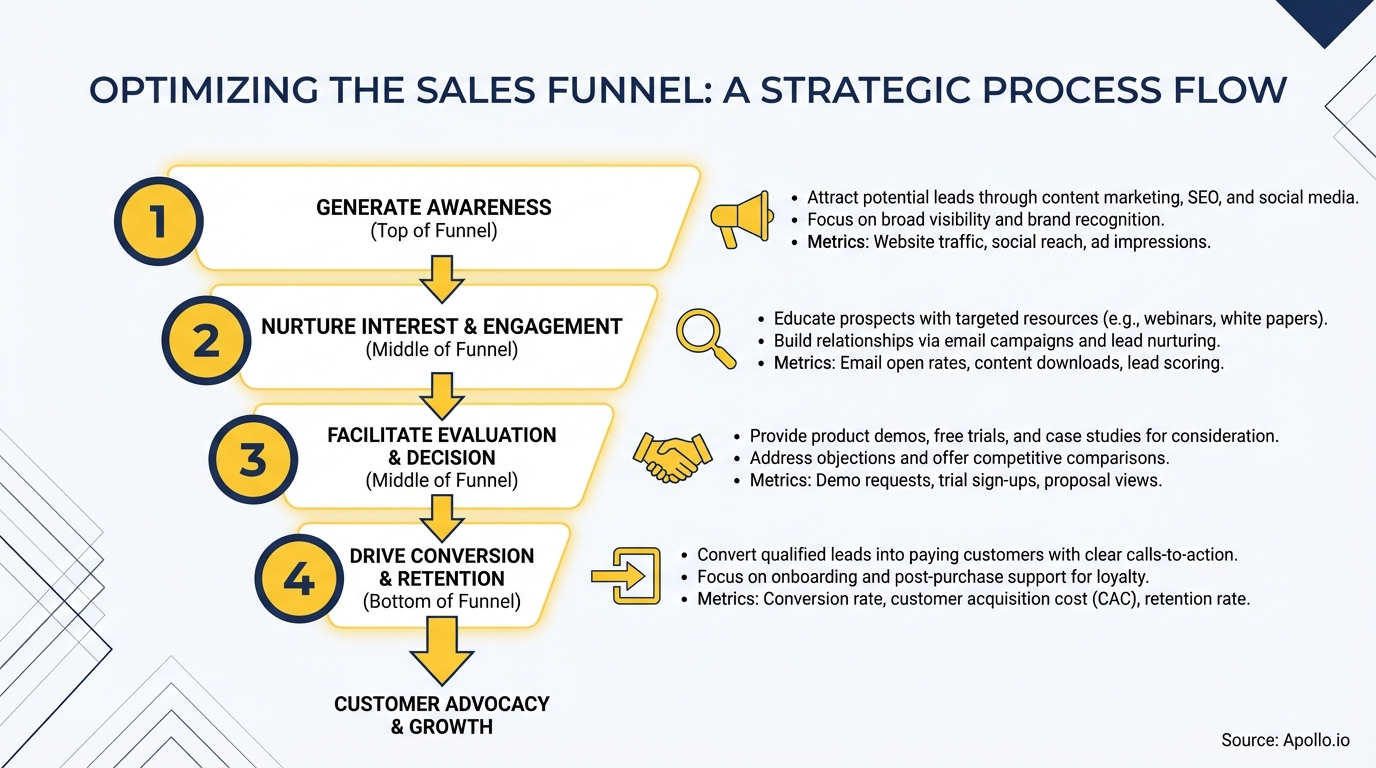
A sales funnel graphic is a visual representation of how prospects move from initial awareness to closed deals. In 2026, effective funnel graphics map non-linear buyer journeys that include self-service research, peer validation, and internal stakeholder alignment stages.
Unlike traditional linear funnels that assume rep-led progression, modern funnel graphics acknowledge that buyers enter and exit at multiple points. They research solutions independently, loop back to earlier stages, and involve buying committees of stakeholders. According to LXA Hub, the average B2B sales cycle has increased by 22% over the past five years due to more decision-makers being involved in the buying process.
Your funnel graphic should visualize these realities:
- Awareness Stage: Anonymous research, content consumption, peer recommendations
- Consideration Stage: Product comparisons, demo requests, stakeholder education
- Decision Stage: Proof of value, buying group consensus, contract negotiation
- Retention Stage: Onboarding, expansion, advocacy
Why Do Sales Leaders Need Non-Linear Funnel Models?
Sales leaders managing teams in 2026 need funnel graphics that reflect actual buyer behavior, not idealized linear paths. Buyers now prefer rep-free experiences and form vendor preferences before engaging sales.

The data shows dramatic shifts in buyer expectations. Research from ElectroIQ found that only 34% of companies regularly optimize their sales funnel. This creates competitive advantage for teams using modern funnel frameworks that align content, messaging, and sales motions to how buyers actually research and evaluate solutions.
For RevOps teams and sales leaders, non-linear funnel models enable:
- Accurate forecasting: Identify where deals stall and which stages need content reinforcement
- Resource allocation: Invest in self-service assets that buyers consume during independent research
- Conversion optimization: According to Marketing LTB, the average sales funnel conversion rate across industries is 3-5% (lead-to-customer), making stage-specific improvements critical
- Team alignment: Give SDRs, AEs, and marketing shared visibility into the true buyer journey
Tired of juggling multiple sales tools? Apollo unifies prospecting, engagement, and pipeline tracking in one workspace.
How Do SDRs Use Funnel Graphics to Book More Meetings?
SDRs use funnel graphics to identify which prospects are ready for outreach and which need more nurturing content. Modern funnel visuals show engagement signals like content downloads, pricing page visits, and feature comparisons that indicate buyer intent.
For SDRs building pipeline in 2026, funnel graphics provide:
- Timing intelligence: Know when prospects transition from research to evaluation mode
- Personalization data: Reference specific content prospects consumed in outreach messages
- Stakeholder mapping: Identify multiple contacts within target accounts who engage with your content
- Channel optimization: See which touchpoints (email, phone, social) move prospects through stages
Modern B2B sales funnels track digital body language across touchpoints. SDRs who align their outreach to funnel stage see higher connection and booking rates. Teams using lead generation funnel strategies can automate sequencing based on prospect behavior, ensuring timely and relevant outreach.
See Every Deal Stage in Real Time With Apollo
Forecasts feel like guesswork without real-time deal visibility. Apollo tracks every stage automatically, giving you accurate pipeline data that drives confident revenue planning. Built-In boosted win rates 10% with Apollo's scoring.
Start Free with Apollo →What Are the Critical Stages in a 2026 Sales Funnel Graphic?
Modern sales funnel graphics must include six critical stages that reflect buying group dynamics and self-service research patterns. These stages map to actual buyer behaviors rather than internal sales processes.
| Funnel Stage | Buyer Activity | Content Types | Sales Action |
|---|---|---|---|
| Anonymous Research | Problem identification, solution education | Blog posts, guides, comparison content | SEO optimization, content distribution |
| Known Prospect | Form fills, content downloads, demo requests | Webinars, case studies, product overviews | SDR outreach, personalized sequences |
| Qualified Opportunity | Multi-stakeholder evaluation, vendor comparison | ROI calculators, technical docs, customer proof | Discovery calls, product demos, POC |
| Buying Committee | Internal alignment, budget approval, consensus building | Stakeholder-specific decks, business cases, security docs | Champion enablement, executive engagement |
| Contract Negotiation | Terms review, legal approval, final sign-off | Contract templates, SLAs, implementation plans | Deal management, objection handling |
| Customer Expansion | Onboarding, feature adoption, upsell evaluation | Training materials, success metrics, expansion playbooks | Account management, renewal strategy |
How Do Buying Groups Impact Funnel Design?
Buying groups require stakeholder-specific content at each funnel stage. Your funnel graphic should visualize multiple decision-makers evaluating different aspects of your solution simultaneously.

For Account Executives managing complex deals, this means creating content bundles for economic buyers (ROI focus), technical evaluators (integration requirements), and end users (usability concerns). Research from Gradient Works shows win rates have decreased to 17-20% in 2023, making buying group alignment critical for closing deals.
How Can RevOps Teams Optimize Funnel Conversion Rates?
RevOps teams optimize funnel conversion by identifying stage-specific drop-off points and implementing targeted interventions. Modern funnel graphics with conversion metrics at each stage enable data-driven optimization.
Key optimization strategies include:
- Stage velocity analysis: Measure time spent in each stage and identify bottlenecks
- Content gap identification: Find stages where prospects stall due to missing information
- Lead scoring refinement: Adjust qualification criteria based on conversion patterns
- Sales process alignment: Ensure rep activities match actual buyer progression
A study from Usermaven found that conversion rates from website traffic to leads typically range between 1-3%. RevOps leaders can improve these metrics by mapping content to buyer intent and removing friction from conversion paths.
Struggling to track deals across multiple tools? Apollo's deal management provides complete pipeline visibility in one platform.
What Tools Help Teams Build Modern Sales Funnel Graphics?
Modern sales funnel graphics require tools that track buyer behavior across digital touchpoints and visualize non-linear progression. The best solutions integrate prospecting data, engagement metrics, and pipeline analytics in unified dashboards.
Teams building effective funnel graphics in 2026 need:
- Buyer intent tracking: Monitor content consumption, website visits, and engagement signals
- Multi-touch attribution: Understand which touchpoints influence progression
- Stakeholder mapping: Visualize buying group composition and engagement levels
- Conversion analytics: Measure stage-to-stage conversion rates and identify optimization opportunities
Apollo consolidates these capabilities into one workspace, eliminating the need for separate prospecting, engagement, and analytics tools. As one customer shared, "We reduced the complexity of three tools into one" (Predictable Revenue). This unified approach gives sales teams real-time visibility into funnel performance without switching between platforms.
Start Building Your Modern Sales Funnel Today
Sales funnel graphics in 2026 must reflect non-linear buyer journeys, buying group dynamics, and self-service research patterns. Traditional linear funnels fail to capture how modern B2B buyers actually evaluate and purchase solutions.
Effective funnel graphics visualize multiple entry points, research loops, and stakeholder-specific content needs. They enable SDRs to time outreach perfectly, help AEs navigate complex buying committees, and give RevOps teams the data needed to optimize conversion rates at every stage.
Teams using modern funnel frameworks can identify where deals stall, which content drives progression, and how to allocate resources for maximum impact. With conversion rates averaging just 3-5% across industries, funnel optimization creates measurable competitive advantage.
Apollo brings prospecting, engagement, and pipeline management together in one platform. Track buyer behavior, automate multi-channel sequences, and visualize your entire funnel without juggling separate tools.
Join teams like Census who "cut costs in half" and Cyera who found "having everything in one system was a game changer."
Prove Apollo's ROI In Your First 30 Days
Budget approval stuck on unclear metrics? Apollo tracks every dollar of pipeline impact automatically. Built-In increased win rates 10% and ACV 10% with measurable Apollo insights.
Start Free with Apollo →Don't miss these
Sales
Inbound vs Outbound Marketing: Which Strategy Wins?
Sales
What Is a Sales Funnel? The Non-Linear Revenue Framework for 2026
Sales
What Is a Go-to-Market Strategy? The 2026 GTM Playbook
See Apollo in action
We'd love to show how Apollo can help you sell better.
By submitting this form, you will receive information, tips, and promotions from Apollo. To learn more, see our Privacy Statement.
4.7/5 based on 9,015 reviews
