
What Is the Sales Efficiency Formula and How Do You Use It in 2026?
Most sales teams measure activity. The best measure return. The sales efficiency formula converts your total sales and marketing spend into a single ratio that tells you whether your GTM motion is generating more revenue than it costs. Learn how to improve sales efficiency with RevOps and use this metric as a capital allocation tool, not just a reporting number.
Research Less, Close More With Apollo
Tired of burning hours on manual lead research while your pipeline stalls? Apollo surfaces verified contacts instantly so your team spends time selling, not searching. Join 550K+ companies turning research time into revenue.
Start Free with Apollo →Key Takeaways
- The sales efficiency formula measures new revenue generated per dollar of sales and marketing spend.
- A healthy sales efficiency ratio sits between 0.8 and 1.2, meaning every dollar spent returns close to or more than one dollar in revenue.
- Sales reps spend only 28% to 33% of their time actively selling — reducing admin is the fastest way to move the ratio.
- Pairing the efficiency ratio with CAC payback and net revenue retention gives a complete picture of GTM health.
- AI-driven automation and tool consolidation are the primary levers for improving your efficiency score in 2026.
What Is the Sales Efficiency Formula?
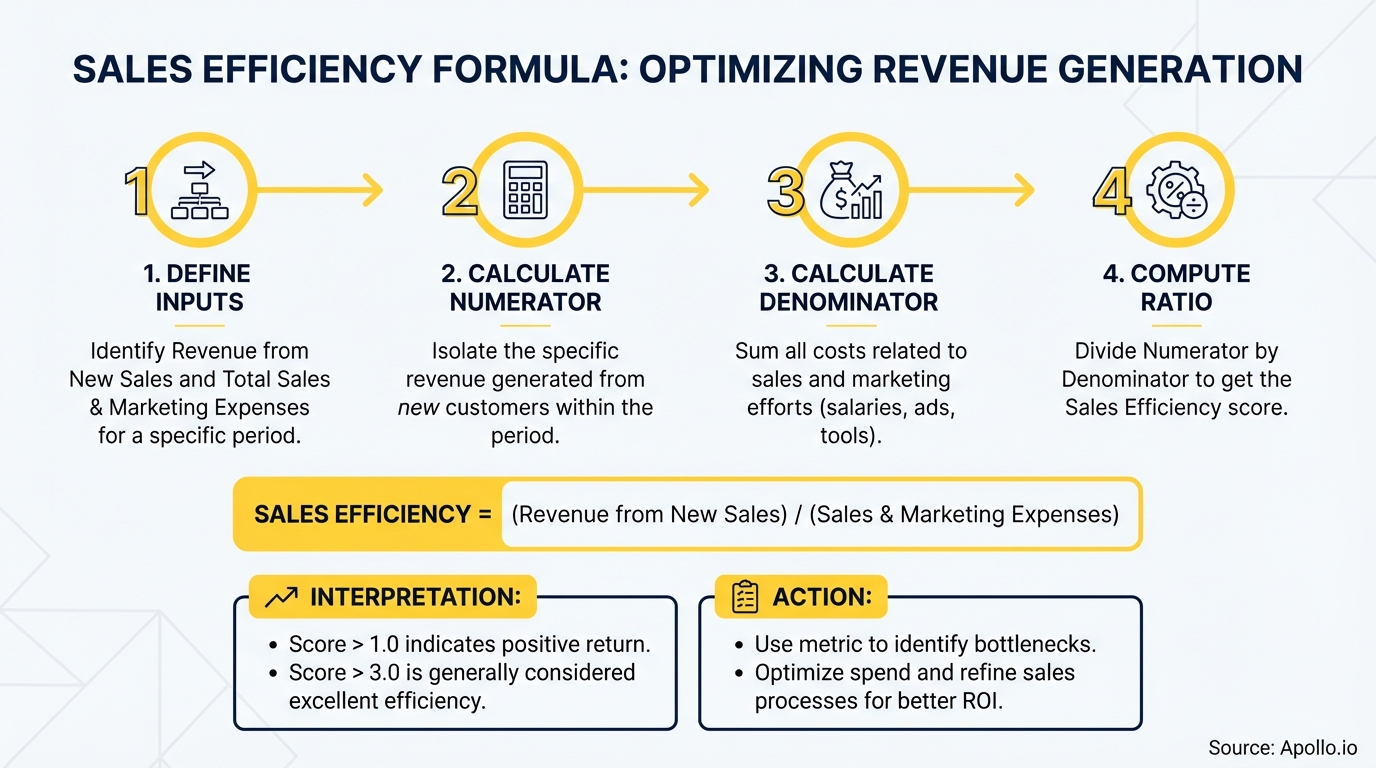
The sales efficiency formula calculates how much new revenue a company generates for every dollar invested in sales and marketing. The core formula is:
Sales Efficiency = New ARR (or Revenue) Generated / Sales & Marketing Spend
According to Forecastio, a healthy sales efficiency ratio typically ranges between 0.8 and 1.2 — meaning for every dollar spent on sales and marketing, the company generates close to or more than one dollar in revenue. A ratio above 1.0 signals efficient growth. Below 0.5 indicates a broken GTM motion that needs structural repair.
| Ratio | Signal | Action |
|---|---|---|
| Above 1.2 | Highly efficient — invest aggressively | Scale headcount and spend |
| 0.8 – 1.2 | Healthy — optimize selectively | Improve conversion rates and ACV |
| 0.5 – 0.8 | Below benchmark — identify leaks | Audit pipeline stages and CAC by channel |
| Below 0.5 | Inefficient — structural issue | Rebuild ICP targeting and qualification |
Why Is the Sales Efficiency Formula Important in 2026?
The sales efficiency formula has evolved from a reporting metric into a capital allocation tool. In an environment where boards demand efficient growth, a strong efficiency ratio determines which channels and segments receive budget.
The formula is also increasingly paired with CAC payback period and net revenue retention — because a high efficiency score can still mask churn risk or cash-flow strain.
The buyer environment makes this more urgent. A Gartner survey (fielded Aug–Sep 2024) found that 73% of B2B buyers actively avoid suppliers who send irrelevant outreach. Wasted outreach is a direct cost drag on your denominator. Understanding the sales acceleration formula alongside efficiency metrics helps teams build outreach that converts rather than alienates.
Turn Funnel Guesswork Into Closed Deals
Pipeline forecasting a guessing game because quality leads never make it through? Apollo surfaces in-market buyers at the right moment, turning weak top-of-funnel into real opportunities. Over 550K companies now forecast with confidence.
Schedule a Demo →How Do You Decompose the Formula by Channel and Stage?
A single blended efficiency ratio hides where your GTM is winning or leaking. Decomposing by channel and funnel stage reveals the real story. Use this stage-based framework to pinpoint friction:
- Cost-to-MQL: Total marketing spend divided by MQLs generated. High cost signals ICP misalignment or poor content pre-qualification.
- Cost-to-SQL: Sales development spend divided by SQLs. High cost points to low-quality lead routing or weak discovery.
- Cost-to-Opportunity: Combined spend divided by open opportunities. Tracks how efficiently reps convert interest to pipeline.
- Cost-to-Close: Total GTM spend divided by closed-won deals. The ultimate denominator-level metric for deal efficiency.
Separate your self-serve channel from sales-assisted. McKinsey's 2024 B2B Pulse Survey found that for companies offering e-commerce, that channel now generates more than one-third of revenue — while in-person revenue fell to 17%.
Self-serve deals carry near-zero sales cost, dramatically improving your efficiency ratio if measured separately. Track them independently so sales-assisted costs don't artificially inflate your self-serve efficiency score.
Struggling to build a qualified pipeline efficiently? Use Apollo's AI-powered pipeline builder to fill your funnel with the right accounts from day one.

How Do RevOps Leaders and SDRs Improve the Ratio?
The formula's denominator has two levers: reduce wasted spend, or increase revenue per rep. Both require fixing how time is allocated.
Research from Trykondo shows that sales representatives spend only 28% to 33% of their time actively selling — the rest is consumed by administrative tasks and navigating disconnected tools. That is the efficiency gap. According to Subskribe, automating repetitive tasks can lead to reps spending 30–40% more time actually selling.
For SDRs and BDRs: Consolidating prospecting, sequencing, and dialing into one platform eliminates tool-switching and data re-entry. More selling time per rep = lower cost-to-SQL without adding headcount.
For RevOps leaders: Align lead scoring, routing rules, and CRM hygiene to ensure only high-fit prospects enter the sales-assisted funnel. Poor routing is a silent efficiency killer — reps burn quota capacity on deals that should never have been accepted. Use sales analytics to identify which lead sources produce the highest cost-to-close and cut or reallocate accordingly.
For Sales Leaders and Founders: Tool consolidation is the fastest structural fix. "We reduced the complexity of three tools into one" — Collin Stewart, Predictable Revenue. Fewer integrations to maintain means lower overhead and cleaner data feeding your efficiency calculations.
Spending too much time on manual outreach instead of selling? Automate your multi-channel sequences with Apollo and reclaim selling time.
What Role Does Sales and Marketing Alignment Play?
Misalignment between sales and marketing is one of the most expensive efficiency drains in B2B. According to Brainstorm Club, only 8% of companies have achieved strong alignment between their sales and marketing departments. That gap shows up directly in your efficiency ratio — as wasted spend on leads that never convert.
When alignment improves, the impact is quantifiable. Research from Influ2 shows pipeline conversions from target buying groups are boosted by an average of 65% when marketing actively supports the sales process, compared to cold outreach alone.
Practical alignment steps that move the efficiency ratio:
- Define a shared ICP and MQL/SQL criteria in writing
- Run weekly pipeline reviews with marketing present
- Use content assets (ROI calculators, security checklists, case studies) to support mid-funnel buying committee education
- Feed sales call intelligence back to marketing for content gap identification
This is especially critical for enterprise sales where buying committees are large and content must carry workload that reps cannot handle at scale. Forrester's 2025 B2B Marketing and Sales Predictions found that more than half of large B2B transactions worth $1M+ will be processed through digital self-serve channels — meaning content that reduces friction in the evaluation stage directly improves deal efficiency for high-ACV opportunities.

How Do You Build a Repeatable System to Improve Sales Efficiency Over Time?
A one-time calculation changes nothing. The teams that sustainably improve their efficiency ratio operate a repeatable system with four components:
- Instrument your funnel: Track cost-to-MQL, cost-to-SQL, cost-to-opportunity, and cost-to-close by channel, segment, and rep every quarter.
- Run content experiments: A/B test outreach formats, sequences, and buyer-enablement assets. Measure impact on conversion rates at each stage — not just open rates.
- Automate the denominator: Deploy sales automation software to handle scoring, routing, follow-up sequences, and meeting scheduling. Each automated touchpoint reduces cost-per-outcome.
- Review and reallocate quarterly: Kill low-efficiency channels. Double down on what produces ratios above 1.0. Use the formula as a budget decision tool, not a historical report.
The best-performing teams also layer in sales productivity metrics — revenue per rep, quota attainment rates, and ramp time — alongside the efficiency ratio to get a complete picture. Data from Rachel A. Krug shows that up to 70% of B2B sales representatives missed their annual quota in 2024. That quota attainment gap is both an input and an output of poor efficiency — fixing the formula fixes the number.
Building your sales tech stack around a unified platform rather than stitching together point solutions keeps your data clean and your cost structure lean — both critical inputs to a strong efficiency ratio.
Start Improving Your Sales Efficiency Ratio Today
The sales efficiency formula is the clearest signal of whether your GTM motion is working. Calculate your current ratio, decompose it by channel and stage, then target the specific leaks: wasted outreach, poor alignment, admin-heavy workflows, or fragmented tools.
Apollo consolidates prospecting, engagement, enrichment, and pipeline management into one platform — so every dollar of sales and marketing spend works harder. "Having everything in one system was a game changer" — Cyera. "We cut our costs in half" — Census.
Ready to move your efficiency ratio in the right direction? Get Leads Now and see how Apollo's unified GTM platform helps you generate more revenue from every dollar you spend.
Prove Pipeline ROI With Apollo
Budget approval stuck on unclear metrics? Apollo delivers measurable pipeline impact your leadership can act on. Leadium 3x'd their annual revenue — see your ROI before you commit.
Schedule a Demo →Don't miss these
Sales
Inbound vs Outbound Marketing: Which Strategy Wins?
Sales
What Is a Sales Funnel? The Non-Linear Revenue Framework for 2026
Sales
What Is a Go-to-Market Strategy? The 2026 GTM Playbook
See Apollo in action
We'd love to show how Apollo can help you sell better.
By submitting this form, you will receive information, tips, and promotions from Apollo. To learn more, see our Privacy Statement.
4.7/5 based on 9,015 reviews
