
Sales Commission Rates by Industry: 2025 Benchmarks and Best Practices
Sales commission structures directly impact your ability to attract top talent, motivate performance, and protect profitability. Yet most sales leaders struggle to benchmark their rates against industry standards because the landscape has fundamentally shifted. Tracking the right sales KPIs becomes critical when your commission plan misaligns with market expectations or your gross margins.
Apollo Eliminates 4+ Hours Of Daily Research
Tired of spending 4+ hours daily hunting for contact info? Apollo delivers 224M verified contacts with 96% email accuracy instantly. Join 550K+ companies who turned research time into selling time.
Start Free with Apollo →Key Takeaways
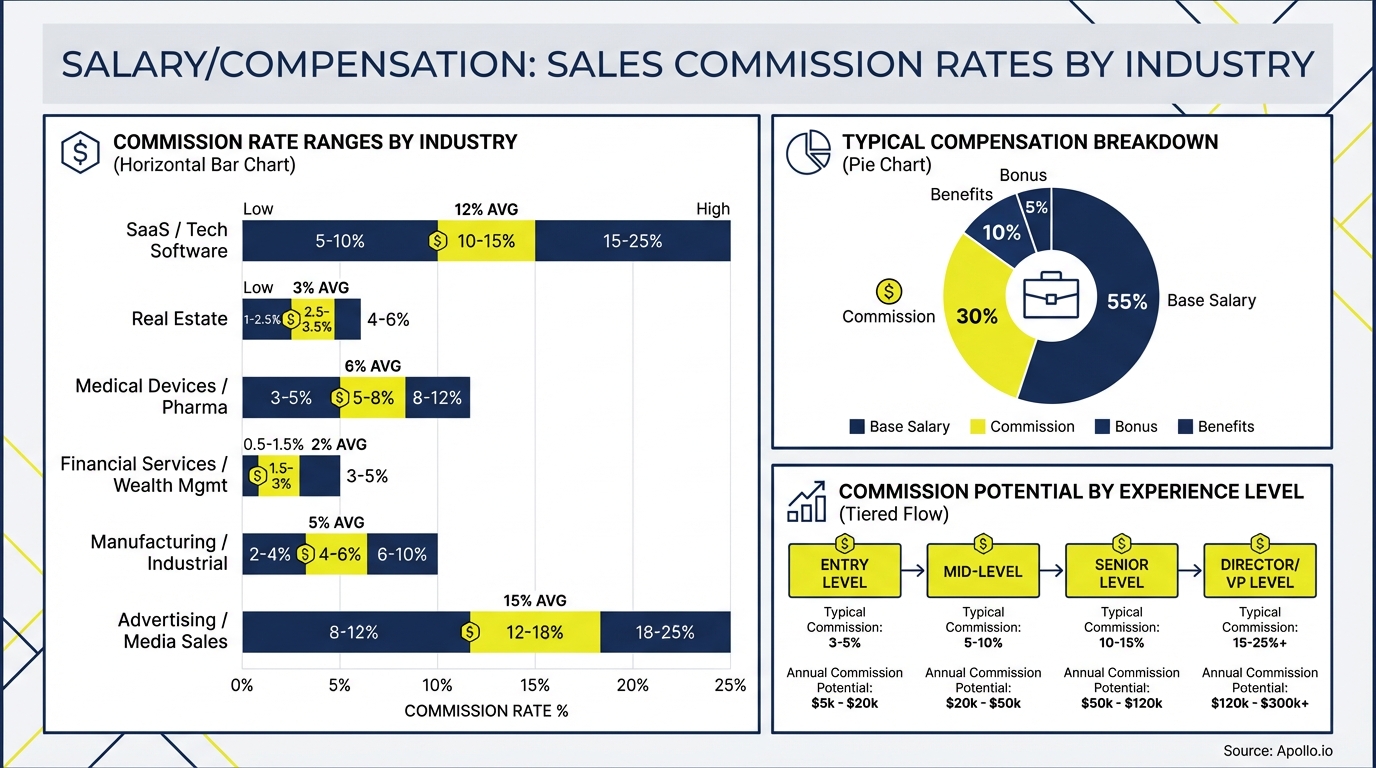
- Commission rates vary dramatically by industry, from 7% for physical products to 50%+ for SaaS and services
- The classic 50/50 base/variable split remains dominant in 2026, but specialized roles are shifting toward retention-focused incentives
- Effective commission rates differ from headline rates once you factor in payment gates, margin bands, and clawbacks
- Sales leaders must calculate compensation cost of sales (CCOS) to ensure commissions remain sustainable
- Modern commission plans increasingly reward content influence, ICP fit, and multi-threaded deals alongside closed-won revenue
What Are Sales Commission Rates by Industry in 2026?
Sales commission rates represent the percentage of deal value paid to sales representatives as variable compensation. According to Visdum, across industries, most sales commission rates typically fall within 5% to 20% of the sale value, with variations based on product complexity, sales cycle length, and profit margins.
However, this broad range masks critical differences. Research from Qobra shows B2B sales commission rates generally range from 7% to 15% for physical products and 20% to 50% or more for services and SaaS, due to lower overhead per sale. The gap between physical goods and digital services reflects fundamentally different margin structures and sales complexity.
In 2026, these ranges are fragmenting further as companies shift from pure bookings incentives to retention economics. Account Executives managing recurring revenue now see split commission structures: one rate for new ARR, another for renewals, and often a third for expansion. This complexity reflects buyer behavior changes and the rising importance of sales productivity metrics beyond first-signature revenue.
How Do Commission Rates Differ Across Major Industries?
Industry-specific commission rates in 2026 reflect margin economics, sales cycle complexity, and competitive talent markets. Here's how rates break down across key B2B sectors:
| Industry | Typical Commission Rate | Pay Mix (Base/Variable) | Key Drivers |
|---|---|---|---|
| SaaS & Technology | 10-12% of ACV | 50/50 to 53/47 | Recurring revenue, retention metrics, expansion potential |
| Professional Services | 20-50% of contract value | 40/60 to 50/50 | Lower overhead, relationship-driven, scope complexity |
| Manufacturing & Distribution | 5-10% of sale value | 60/40 to 70/30 | Lower margins, longer cycles, channel dynamics |
| Financial Services | 8-15% with overlays | 50/50 to 45/55 | Regulatory constraints, relationship value, cross-sell |
| Healthcare & Life Sciences | 7-12% of contract value | 55/45 to 60/40 | Compliance requirements, clinical validation, long cycles |
Data from Incentivate Solutions confirms the 2026 average rate for Software and Technology (SaaS) sits at 10% to 12% of Annual Contract Value (ACV). This rate typically applies to new ARR, with separate structures for renewals (often 5-8%) and expansion (8-15%).

For Sales Leaders managing teams across multiple products or segments, these variations create planning challenges. The solution lies in unified deal management systems that track commission calculations across different rate cards without manual spreadsheet reconciliation.

What Is Compensation Cost of Sales and Why Does It Matter?
Compensation Cost of Sales (CCOS) represents total sales compensation as a percentage of revenue. This metric determines the maximum sustainable commission rate for your business model.
Alexander Group benchmarks healthy CCOS at 8-15% for B2B companies, providing the economic ceiling for commission design.
Here's how to calculate your maximum commission rate:
- Step 1: Determine your target CCOS (typically 10-12% for SaaS, 8-10% for services)
- Step 2: Calculate base salary as % of OTE (usually 45-55%)
- Step 3: Subtract base salary costs from total CCOS budget
- Step 4: Divide remaining budget by expected revenue per rep to get commission %
Example: A SaaS company with 11% target CCOS, $100K base salary, and $1M quota per rep has $110K total comp budget. After $100K base, $10K remains for commission, yielding a 1% effective rate.
To hit market-competitive 10% commission rates, this company needs either higher quotas, lower base salaries, or acceptance of higher CCOS.
RevOps leaders use CCOS to spot unsustainable commission plans before they damage margins. When actual CCOS exceeds 15%, companies typically face pressure to reduce rates, increase quotas, or implement stricter qualification gates.
How Should Sales Leaders Structure Commission Plans in 2026?
Modern commission plans balance multiple objectives: attracting talent, driving behavior, protecting margins, and reflecting buyer journey complexity. CaptivateIQ reports the classic 50/50 split between base and variable compensation remains the dominant approach for most sales organizations in 2025, but structure matters as much as split.
What Commission Structure Works Best for SaaS Companies?
SaaS commission plans in 2026 increasingly use multi-metric structures:
- New ARR: 10-12% of first-year contract value
- Renewals: 5-8% of renewed ARR (often paid to Account Managers, not AEs)
- Expansion: 8-12% of incremental ARR from upsells and cross-sells
- Accelerators: 15-20% rates above 100% quota attainment
According to Everstage, over 60% of SaaS companies prioritize outcomes like renewals, upsells, and multithreaded deals as key compensation drivers. This shift reflects the reality that first-signature revenue no longer predicts long-term customer value.
For SDRs and BDRs feeding pipeline, commission structures now often include ICP qualification bonuses (additional 10-20% for deals matching ideal customer profile) and content engagement metrics (bonus for prospects who consume key assets before first call). This aligns incentives with modern buying behavior where 61% of B2B buyers prefer self-directed research.
How Do Account Executives Earn Commissions on Complex Deals?
Account Executives managing high-ticket sales often work multi-threaded deals with 6-12 month cycles. Their commission plans typically include:
- Milestone payments: 20% on technical validation, 30% on contract signature, 50% on go-live
- Margin bands: Base rate for 40-50% margin deals, 1.5x rate for 60%+ margin
- Multi-year treatment: Full first-year value or 40-50% of total contract value
- Clawback windows: 90-180 day clawback if customer churns or doesn't implement
These structures protect companies from paying full commission on deals that never deliver revenue while still motivating AEs to close. The trade-off is administrative complexity, which modern sales automation software helps manage through automated milestone tracking and payment calculations.
Find Buyers Ready To Close Right Now
Missing in-market prospects while competitors strike first? Apollo reveals buying signals and tracks website visitors so you reach decision-makers at the perfect moment. Built-In increased win rates 10% with smarter timing.
Start Free with Apollo →What Commission Mistakes Do Sales Leaders Make?
The most common commission design failures in 2026 stem from ignoring economics, buyer behavior, or operational complexity:
Mistake 1: Copying SaaS Benchmarks Without Adjusting for Margins
A professional services firm with 35% gross margins cannot afford the same 10-12% commission rates as a SaaS company with 80% margins. The result is either unprofitable deals or sales reps who leave for better compensation.
Solution: Calculate commission as a percentage of gross margin (20-30% of margin) rather than revenue.
Mistake 2: Paying Commission on Bookings Instead of Collections
When companies pay commission at contract signature but customers don't pay for 60-90 days (or ever), cash flow suffers and bad deals get rewarded. Solution: Pay commission on collected cash or implement payment gates (50% at signature, 50% at payment).
Mistake 3: Ignoring Administrative Burden
CaptivateIQ research shows teams spend approximately 36 hours per payout period processing commissions. Complex plans with multiple rate cards, margin bands, and special exceptions consume RevOps capacity and create dispute cycles.
Solution: Simplify wherever possible and invest in commission automation systems.
Mistake 4: Misaligning Incentives With Buyer Journey
Paying pure outbound activity commissions when 61% of buyers prefer rep-free experiences creates misaligned incentives. Sales teams flood prospects with irrelevant outreach rather than creating valuable content and responding to inbound signals.
Solution: Include ICP fit qualifiers and content engagement metrics in commission calculations.
Struggling to track which prospects engage with your content before converting? Advanced sales analytics platforms connect content touches to revenue outcomes, enabling smarter commission attribution.
How Are AI and Automation Changing Commission Structures?
In 2026, AI-assisted commission design is enabling more sophisticated rate optimization. Companies use machine learning to analyze which commission structures drive desired behaviors without overpaying.
Key applications include:
- Dynamic rate cards: AI adjusts commission rates by segment, ACV band, and competitive intensity
- Predictive attainment modeling: Systems forecast quota achievement and recommend accelerator thresholds
- Attribution intelligence: AI credits multiple touches across the buyer journey, not just last-touch
- Anomaly detection: Automated flagging of commission calculations that fall outside normal patterns
Research from Everstage confirms that in 2025, sales compensation is increasingly seen as a growth driver, shifting towards flexible, data-driven, and personalized incentive models. The companies winning in 2026 treat commission design as a continuous optimization problem rather than an annual planning exercise.
For Founders and CEOs building scalable go-to-market motions, this shift toward data-driven compensation requires integrated systems. Trying to optimize commission structures with disconnected tools? Unified go-to-market platforms connect prospecting, engagement, deal tracking, and revenue data in one workspace, eliminating the guesswork in commission attribution.
What Questions Should You Ask When Benchmarking Commission Rates?
Before adopting industry benchmark rates, sales and revenue leaders must answer six critical questions:
- What metrics are commissionable? Bookings vs. collected cash vs. recognized revenue vs. gross margin
- What is your payment timing? At signature, at go-live, at payment receipt, or milestone-based
- Do you use accelerators? Rates above 100% quota attainment and their thresholds
- How specialized are your roles? Different rates for hunters vs. farmers vs. technical sellers
- What is your CCOS target? Total compensation budget as % of revenue
- How mature is your commission infrastructure? Spreadsheets vs. dedicated ICM systems
Companies with immature commission infrastructure should prioritize simplicity over sophistication. A straightforward 10% of collected cash plan you can administer accurately beats a complex margin-based, multi-metric plan that creates 36 hours of admin work and frequent disputes.
As you scale, building a sales tech stack that automates commission tracking becomes essential. The best systems integrate with your CRM, payment processor, and revenue recognition tools to calculate commissions automatically based on your specific rules.
Start Optimizing Your Sales Compensation Strategy
Sales commission rates by industry provide a starting benchmark, but your optimal structure depends on margin economics, buyer behavior, and operational capacity. The winning approach in 2026 balances market-competitive rates with sustainable CCOS, aligns incentives with modern buying journeys, and maintains administrative simplicity.
Key implementation steps:
- Calculate your current CCOS and compare to the 8-15% healthy range
- Map your commission structure against industry benchmarks for your sector
- Audit payment gates, margin bands, and clawback policies
- Evaluate whether your plan rewards ICP fit and content engagement
- Measure administrative burden and identify automation opportunities
For Sales Leaders managing teams across complex deal cycles, the difference between effective and ineffective commission structures shows up in both rep performance and company profitability. When reps understand exactly how they earn, trust the calculation accuracy, and see clear paths to overachievement, quota attainment improves.
Ready to build a sales compensation strategy that drives revenue while protecting margins? Start free with Apollo to access the sales intelligence, deal tracking, and analytics capabilities that power commission optimization at leading B2B companies.
Prove Apollo's ROI In Your First 30 Days
Budget approval stuck on unclear metrics? Apollo tracks every touchpoint from prospect to closed deal, giving you measurable pipeline impact and time savings. Built-In increased win rates 10% and ACV 10% with clear attribution.
Start Free with Apollo →Don't miss these
Sales
Inbound vs Outbound Marketing: Which Strategy Wins?
Sales
What Is a Sales Funnel? The Non-Linear Revenue Framework for 2026
Sales
What Is a Go-to-Market Strategy? The 2026 GTM Playbook
See Apollo in action
We'd love to show how Apollo can help you sell better.
By submitting this form, you will receive information, tips, and promotions from Apollo. To learn more, see our Privacy Statement.
4.7/5 based on 9,015 reviews
