
Return on Sales Formula: Calculate Profitability and Drive Revenue Growth
Understanding your return on sales formula is the difference between guessing at profitability and building a predictable revenue engine. Sales leaders, RevOps teams, and founders need clear metrics to measure operational efficiency and make data-driven decisions about resource allocation. This guide breaks down the ROS formula, shows you how to calculate it, and connects it directly to sales analytics that actually drive revenue growth.
Apollo Eliminates 4+ Hours Of Daily Research
Tired of spending 4+ hours daily hunting for contact info? Apollo delivers 224M verified contacts with 96% email accuracy—instantly. Join 550K+ companies who replaced manual research with predictable pipeline.
Start Free with Apollo →Key Takeaways
- Return on sales measures how much profit your company generates per dollar of revenue, revealing operational efficiency at a glance.
- The ROS formula (Operating Profit ÷ Net Sales × 100) gives you a percentage that benchmarks against competitors and tracks performance over time.
- Sales leaders can use ROS insights to optimize pricing strategies, reduce operational costs, and align sales activities with profitability goals.
- Connecting ROS metrics to your sales tech stack helps RevOps teams consolidate tools and reduce costs while improving performance visibility.
- High-growth SaaS companies typically maintain different ROS benchmarks than mature enterprises, requiring stage-appropriate measurement approaches.
What Is the Return on Sales Formula?
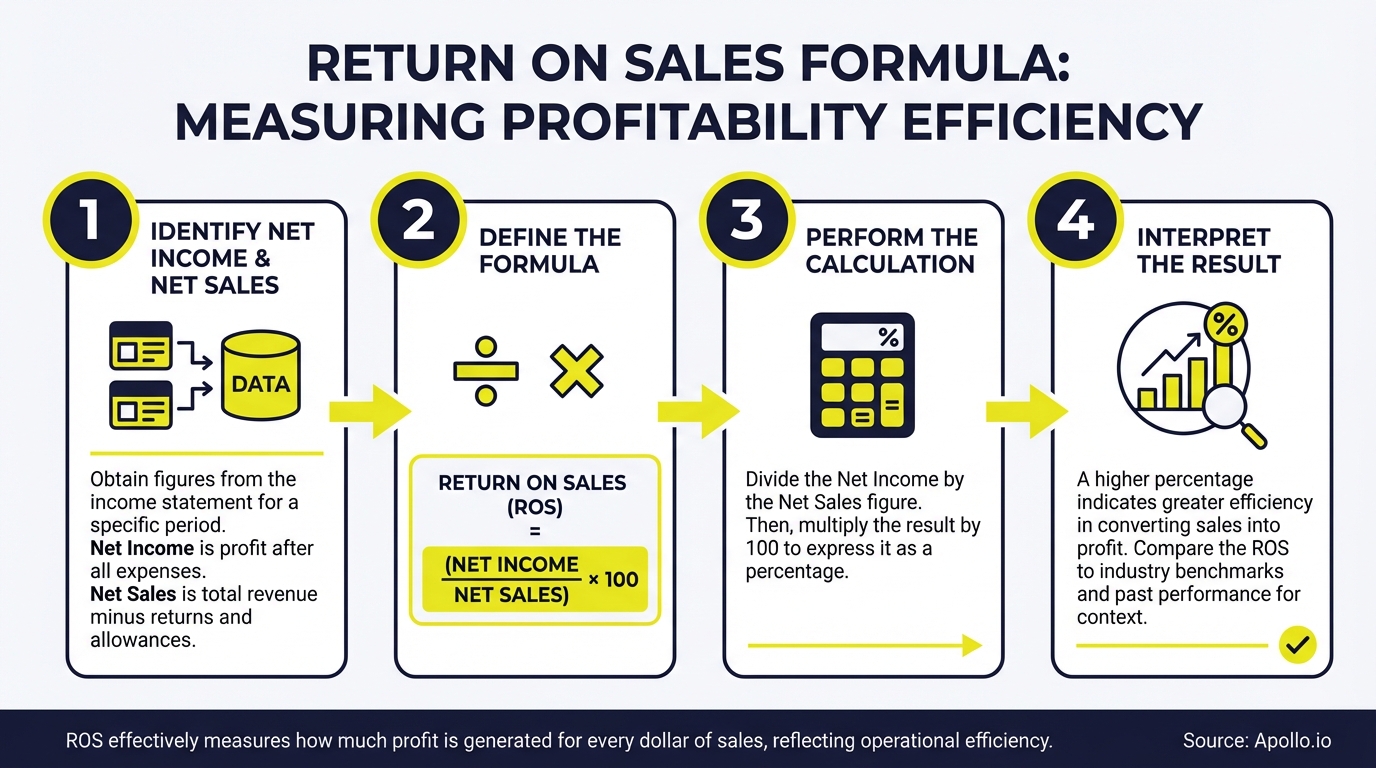
The return on sales (ROS) formula measures operating profitability by calculating how much profit your company generates for every dollar of sales revenue. It's calculated as: ROS = (Operating Profit ÷ Net Sales) × 100.
This percentage reveals operational efficiency and shows whether your sales operations are translating revenue into actual profit.
Unlike gross margin, ROS accounts for operating expenses like sales team salaries, marketing spend, and technology costs. For sales leaders managing B2B sales organizations, this metric connects directly to decisions about headcount, tool investments, and go-to-market strategy.
According to MetricHQ, high-growth SaaS companies typically maintain sales and marketing to revenue ratios between 40-80%, while established technology companies operate between 20-40%. These benchmarks help contextualize your ROS performance against industry standards.
How Do You Calculate Return on Sales?
Calculating ROS requires two financial inputs: operating profit (also called operating income or EBIT) and net sales revenue. Operating profit equals your total revenue minus cost of goods sold and operating expenses.
Net sales represent total revenue minus returns, allowances, and discounts.
Here's the step-by-step calculation process:
- Step 1: Find your operating profit on your income statement (Revenue - COGS - Operating Expenses)
- Step 2: Identify your net sales figure (Total Revenue - Returns - Discounts)
- Step 3: Divide operating profit by net sales
- Step 4: Multiply by 100 to convert to a percentage
Example: If your company has $5M in net sales and $750K in operating profit, your ROS is 15% ($750K ÷ $5M × 100). This means you generate $0.15 in profit for every dollar of sales.
Why Is Return on Sales Important for Sales Leaders?
ROS gives sales leaders a clear efficiency metric that connects revenue generation to profitability. While revenue growth matters, unprofitable growth burns cash and creates unsustainable business models.
ROS reveals whether your sales operations are cost-effective or require optimization.
For Account Executives managing large deals, ROS insights inform pricing decisions and discount strategies. If your ROS is declining, aggressive discounting might be eroding margins faster than volume compensates. RevOps leaders use ROS to evaluate technology investments and justify sales tech stack consolidation that reduces operating expenses.
Research by Sales Management Association found that over 60% of content created by B2B marketing departments goes unused by sales teams. This inefficiency directly impacts ROS by inflating operating costs without corresponding revenue impact. Struggling to align sales and content ROI? Apollo's AI sales automation consolidates prospecting, outreach, and analytics in one platform, reducing tool sprawl and improving operational efficiency.
Turn Forecast Guesswork Into Revenue Certainty
Pipeline forecasting a guessing game? Apollo's real-time deal tracking gives you accurate visibility across every stage. Built-In increased win rates 10% with Apollo's scoring and signals.
Start Free with Apollo →How Do Sales Teams Use ROS to Improve Performance?
Sales teams apply ROS insights across three key areas: pricing optimization, cost management, and resource allocation. When ROS trends downward, sales leaders investigate whether the issue stems from pricing pressure, rising operating costs, or inefficient sales processes.

| ROS Application | Sales Impact | Action Steps |
|---|---|---|
| Pricing Strategy | Identifies discount impact on margins | Set discount limits, create value-based pricing tiers |
| Cost Management | Reveals operational expense efficiency | Consolidate tools, automate manual processes |
| Resource Allocation | Shows which segments/products drive profit | Reallocate headcount to high-ROS opportunities |
| Sales Process | Highlights inefficiencies in sales cycle | Implement sales development best practices |
SDRs and BDRs benefit from ROS visibility by understanding which prospect profiles convert to profitable customers. Instead of chasing every lead, teams focus on accounts that align with ideal customer profiles and generate sustainable margins.
This shifts activity from volume-based to value-based prospecting.
What ROS Benchmarks Should You Target in 2026?
ROS benchmarks vary significantly by industry, company stage, and business model. SaaS companies typically target 10-20% ROS during growth phases, while mature software businesses may achieve 25-35%.
Manufacturing and retail often operate at 5-10% due to higher cost structures.

Data from MetricHQ indicates that early-stage companies often exceed 100% sales and marketing spend relative to revenue as they prioritize market capture over immediate profitability. As companies mature, this ratio typically drops to 20-40%, directly improving ROS performance.
For 2026 benchmarking, consider these factors:
- Company Stage: Early-stage prioritizes growth over ROS; mature companies optimize for profitability
- Market Position: Market leaders typically maintain higher ROS than challengers due to pricing power
- Business Model: High-touch enterprise sales models often show lower ROS than product-led growth approaches
- Tech Stack Efficiency: Companies using consolidated platforms versus multiple point solutions show 15-30% better operating margins
How Can Sales Leaders Connect ROS to Revenue Operations?
RevOps teams bridge ROS metrics with operational efficiency by tracking how technology investments and process changes impact profitability. The key connection point is operating expenses, where sales tools, headcount, and infrastructure costs directly affect the ROS formula.
Tool consolidation represents one of the highest-impact ROS improvement strategies. Companies using 5-10 separate sales tools for prospecting, engagement, data enrichment, and analytics typically spend 40-60% more on technology than those using integrated platforms.
Customer Census reported, "We cut our costs in half" after consolidating their sales tech stack, directly improving ROS performance.
Can't track which tools actually drive revenue? Apollo's unified GTM platform combines prospecting, engagement, and pipeline management, giving RevOps teams single-platform visibility into what moves deals forward. As Cyera noted, "Having everything in one system was a game changer" for understanding true sales efficiency.
RevOps leaders should track these ROS-connected metrics:
- Cost per opportunity created (marketing and sales expense divided by pipeline generated)
- Technology cost as percentage of revenue (target 2-5% for efficient operations)
- Revenue per sales rep (productivity metric that directly impacts operating profit)
- Sales cycle length (longer cycles increase operating costs and reduce ROS)
Start Improving Your Return on Sales Today
Return on sales gives you a clear, actionable metric for measuring operational efficiency and profitability. By calculating ROS regularly and connecting it to sales activities, pricing decisions, and technology investments, sales leaders build predictable, profitable revenue engines instead of just chasing top-line growth.
The highest-impact ROS improvement strategies focus on cost optimization without sacrificing revenue quality. This means consolidating sales tools, automating manual processes, and focusing team efforts on high-value opportunities that convert efficiently.
Companies that align sales operations with profitability metrics consistently outperform those optimizing for revenue alone.
Ready to improve your ROS through operational efficiency? Start free with Apollo and see how 2M+ users consolidate prospecting, engagement, and analytics into one platform that reduces costs while improving sales performance.
Prove Apollo's ROI In Your First 30 Days
Budget approval stuck on unclear metrics? Apollo tracks every dollar spent to pipeline generated—with real-time ROI dashboards. Built-In increased win rates 10% and ACV 10% using Apollo's scoring.
Start Free with Apollo →Don't miss these
Sales
Inbound vs Outbound Marketing: Which Strategy Wins?
Sales
What Is a Sales Funnel? The Non-Linear Revenue Framework for 2026
Sales
What Is a Go-to-Market Strategy? The 2026 GTM Playbook
See Apollo in action
We'd love to show how Apollo can help you sell better.
By submitting this form, you will receive information, tips, and promotions from Apollo. To learn more, see our Privacy Statement.
4.7/5 based on 9,015 reviews
