
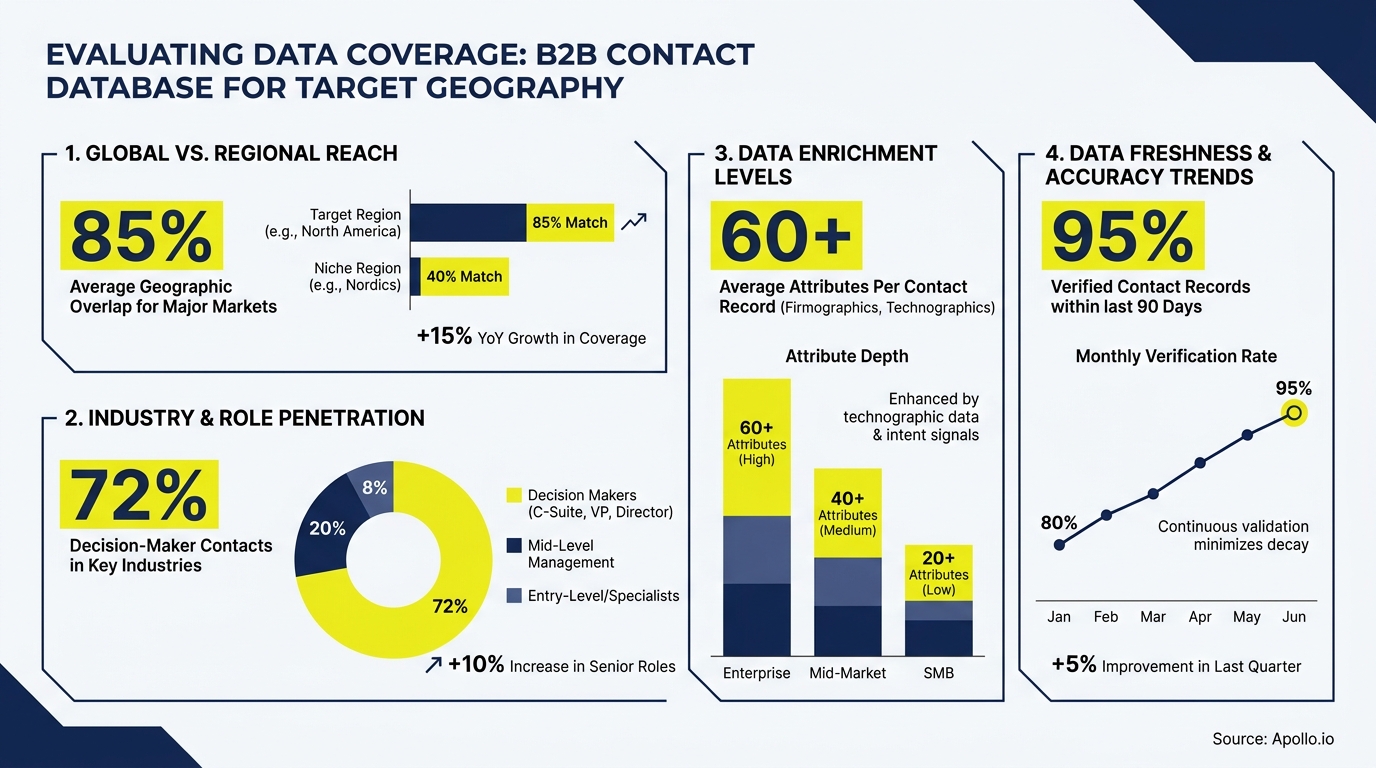
How to Evaluate B2B Contact Database Coverage for Your Target Geography
Most B2B teams ask the wrong question when evaluating a contact database. "How many contacts do you have?" is far less useful than "What is your verified reach in my target geography this quarter?" The difference between those two questions is the difference between wasted spend and a pipeline that actually converts. If your database doesn't cover the right regions, roles, and industries with fresh, deliverable data, your outreach volume becomes noise. This guide gives you a repeatable framework for evaluating B2B contact database coverage by geography before you commit to a vendor or renew a contract.
Research Less, Close More With Apollo
Tired of burning hours verifying contact info that goes nowhere? Apollo delivers 230M+ accurate contacts so your reps spend time selling, not searching. Start building real pipeline today.
Start Free with Apollo →Key Takeaways
- Coverage means verified reach in your target geography, not total database size.
- B2B contact data decays significantly within a year, so freshness and verification cadence are as important as record counts.
- Benchmark vendor coverage against official establishment counts to calculate a real coverage rate for your target states, metros, or industries.
- RevOps leaders should treat geo coverage as an SLA, measuring reachable contacts per region per quarter, not just list size at contract signing.
- Waterfall enrichment and multi-source matching close geographic gaps that no single vendor can fill alone.
What Does "Data Coverage" Actually Mean for a Target Geography?
Geographic data coverage is the percentage of real, reachable businesses and contacts in your target region that a database actually contains with current, deliverable information. Coverage is not the same as database size.
A vendor can hold 300 million records globally while covering only a fraction of the companies in your specific target metro or industry vertical. True coverage requires three things: the company exists in the database for your geography, verified contact records are attached to that company, and those records were confirmed deliverable recently.
For SDRs and BDRs building territory lists, poor geo coverage means hitting quota becomes structurally impossible before a single email is sent. For RevOps leaders managing routing, gaps in regional coverage create uneven territory load and attribution blind spots.
How Do You Benchmark Coverage Against Your Target Geography?
Benchmark geo coverage by calculating what percentage of known establishments in your target area a vendor's database actually contains. Use official establishment counts as your denominator. The 2022 U.S. Economic Census, released December 2024, counted 8.0 million employer establishments nationwide. Use this data by state, metro, and NAICS code to set a realistic denominator for your ICP.
Step-by-step coverage rate calculation:
- Define your ICP by state, metro, industry (NAICS), and employee size band.
- Pull the Economic Census establishment count for that segment as your total addressable market (TAM) denominator.
- Request a sample export from your vendor filtered to the same criteria.
- Divide vendor records by your TAM denominator to get a raw coverage rate.
- Validate a sample of those records for deliverability (email bounce rate, address validity) to get your verified coverage rate.
A coverage rate without a deliverability check overstates your actual reach. Both numbers matter.
Why Does Data Freshness Make or Break Geographic Coverage?
Freshness determines whether your coverage rate translates into actual pipeline or just list volume. According to Marketing Sherpa research cited by SalesMotion, B2B contact databases decay at approximately 2.1% per month, equating to about 22.5% annually. That means a list that tested well at contract signing can lose nearly a quarter of its accuracy within twelve months.
Geo-specific decay is often faster than the average. Business churn is higher in dense metros. CleanList.ai reports that email decay reached 3.6% in a single month in November 2024 alone. Ask every vendor these freshness questions before signing:
- What is the last-verified timestamp on records in my target region?
- What is your re-verification cadence for addresses and emails by geography?
- Do you provide a deliverability guarantee or bounce-rate SLA for specific regions?
Struggling to keep your CRM current with fresh geo data? Apollo's data enrichment keeps your contact records verified and up to date automatically.

How Do RevOps Leaders Build a Geo Coverage Scorecard?
RevOps leaders evaluate geographic coverage using a structured scorecard that combines coverage rate, freshness, deliverability, and provenance into a single vendor comparison view. A strong data enrichment strategy starts with defining what "good" looks like before you run the test.
| Dimension | What to Measure | Minimum Threshold |
|---|---|---|
| Coverage Rate | Vendor records / Census TAM denominator | Set by territory priority |
| Verified Reach | % of records with deliverable email or phone | Ask vendor for region-level bounce rate |
| Freshness | Last-verified timestamp by geo segment | Quarterly re-verification minimum |
| Provenance | How data is sourced and updated | Vendor must disclose sourcing methodology |
| Buying Group Depth | Contacts per account in region across roles | Minimum 3 stakeholder titles per target account |
Run this scorecard for each priority geography before contract signing and repeat it quarterly. Landbase notes that a substantial portion of a database can become outdated within a year, which makes quarterly audits a business requirement, not a best practice.
Turn Funnel Guesswork Into Real Pipeline
Tired of watching marketing leads stall before they ever reach sales? Apollo surfaces high-intent prospects and arms your team with the data to move fast. 600K+ companies trust Apollo to fill pipeline with confidence.
Start Free with Apollo →How Does Waterfall Enrichment Close Geographic Gaps?
Waterfall enrichment closes geographic gaps by querying multiple data sources in sequence, using the next source only when the previous one fails to return a verified result. No single vendor achieves full coverage in every geography. Teams expanding into EMEA, APAC, or specific U.S. markets like the Mountain West or rural metros routinely find that vendor A covers 60-70% of their ICP while vendor B adds incremental lift on the remainder. B2B data enrichment with waterfall matching is how high-performing teams close those gaps systematically rather than discovering them mid-campaign.
To measure incremental lift by geo:
- Export your unmatched accounts from source one, filtered to target geography.
- Run those accounts through source two and track the match rate and deliverability of new records.
- Calculate cost per net-new reachable contact added per region to justify the additional source spend.
What Are the Cost Consequences of Poor Geographic Coverage?
Poor geographic coverage creates direct revenue drag through wasted outreach, inflated sequence volumes, and missed quota in under-covered territories. Data from MarketingLTB shows that data quality issues cost B2B organizations an average of 12% of revenue. That figure compounds when your coverage gaps are concentrated in your highest-priority territories.
For AEs and sales managers, the clearest signal of a geo coverage problem is a territory where connect rates and reply rates are structurally lower than comparable territories, even with similar sequence volume. That gap is usually a data quality issue, not a messaging issue. Contact data enrichment resolves the root cause rather than layering more volume on top of bad records.
Wasting budget on outreach to stale records in your key territories? Search Apollo's 230M+ verified contacts with 65+ filters to find exactly who you need in any geography.
How to Evaluate B2B Database Coverage by Geography in 2026
Evaluating geo coverage in 2026 requires a framework that combines benchmarked coverage rates, freshness audits, deliverability sampling, and waterfall enrichment testing. Use this checklist before any database purchase or renewal:
- Define your TAM denominator: Pull Economic Census establishment counts for your target states, metros, and NAICS codes.
- Request a sample export: Ask vendors for 500-1,000 records matching your ICP filters in your primary geography.
- Run a deliverability test: Check bounce rate on the sample. Flag any geography where bounce exceeds your acceptable threshold.
- Check last-verified timestamps: Reject records older than your cadence requirement. Quarterly minimum for active territories.
- Test buying group depth: Confirm the vendor covers multiple stakeholder titles per target account in-region, not just one contact per company.
- Model waterfall lift: Identify which geographies need a second source and calculate cost per incremental reachable contact.
- Review provenance: Understand how the vendor sources and refreshes data in your target geography, particularly in regulated markets.
Apollo's database of 230M+ people and 30M+ companies, with 97% email accuracy, gives SDRs, AEs, and RevOps teams a verified foundation for any geography. Learn more about which data enrichment tools drive revenue in 2026 to build a complete coverage stack.

Start Evaluating Your Geographic Coverage Today
Geographic coverage is a measurable, auditable metric, not a vendor claim to take at face value. Use the benchmarking methodology, freshness criteria, and geo scorecard in this article to run a structured evaluation before your next database purchase or renewal.
Coverage gaps that go undetected at contract signing become pipeline gaps six months later.
Apollo gives GTM teams a unified platform to prospect, enrich, and engage across any geography, consolidating data, sequencing, and intelligence in one workspace. As Census put it, "We cut our costs in half" by moving to Apollo. Start a free trial and audit your geographic coverage with Apollo today.
Prove Pipeline ROI From Day One
ROI pressure killing your tool budget before you even see results? Apollo delivers measurable pipeline impact fast — 46% more meetings with AI Research Agent. Start free and show leadership the numbers that matter.
Start Free with Apollo →Don't miss these
Sales
Inbound vs Outbound Marketing: Which Strategy Wins?
Sales
What Is a Sales Funnel? The Non-Linear Revenue Framework for 2026
Sales
What Is a Go-to-Market Strategy? The 2026 GTM Playbook
See Apollo in action
We'd love to show how Apollo can help you sell better.
By submitting this form, you will receive information, tips, and promotions from Apollo. To learn more, see our Privacy Statement.
4.7/5 based on 9,015 reviews
