
How to Calculate the Cost of Poor Data Quality on Your Sales Team's Productivity
Your reps aren't underperforming. Your CRM might be the problem. Poor data quality silently drains selling time, corrupts pipeline forecasts, and wastes budget on leads that were never winnable. Before you can fix it, you need to measure it — and most teams never do. This guide gives you a CFO-ready framework to quantify exactly what bad data costs your sales org, role by role. For context on what clean data can unlock, see what sales productivity really means and how to measure it.
Clean Data. Real Contacts. More Pipeline.
Tired of burning hours verifying emails that bounce and numbers that disconnect? Apollo delivers 97% email accuracy across 230M+ verified contacts. Stop chasing dead ends — start booking real meetings.
Start Free with Apollo →Key Takeaways
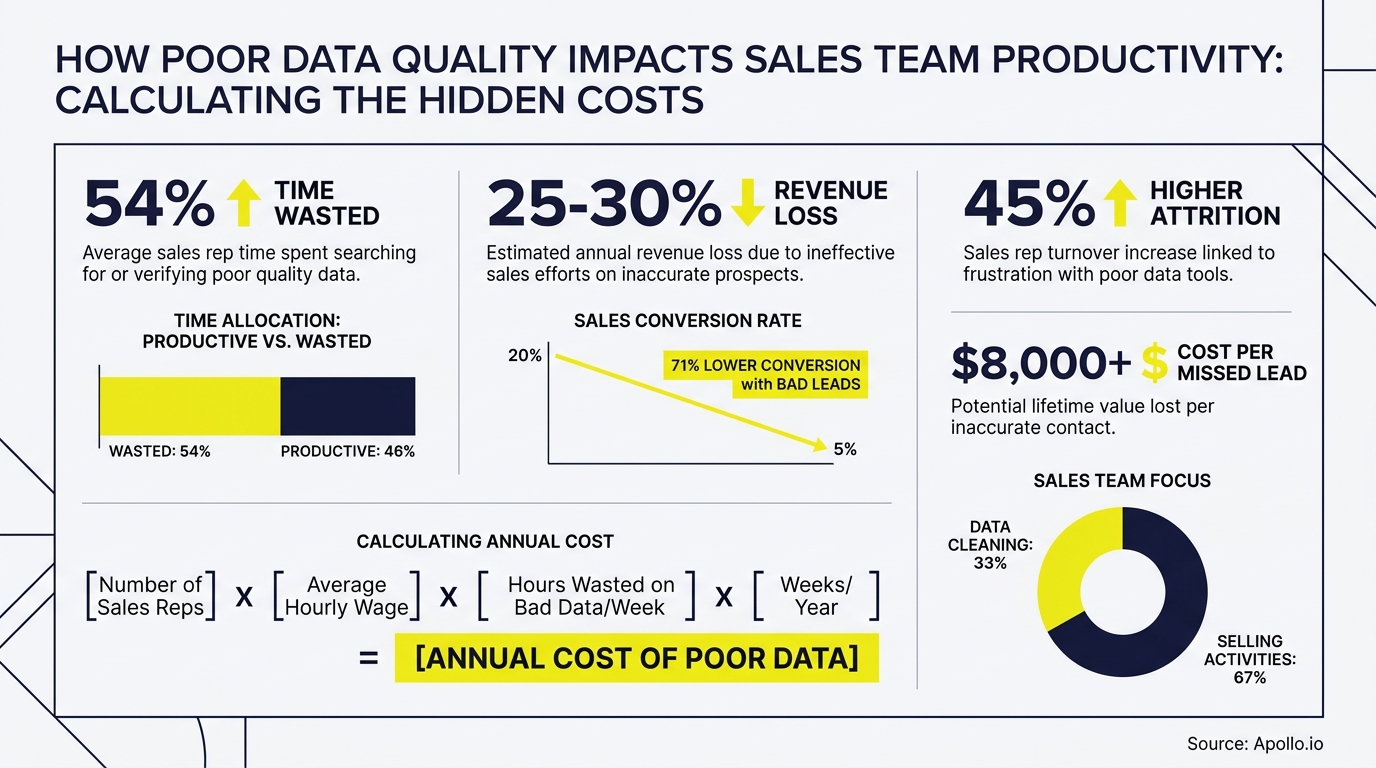
- Poor data quality has a measurable dollar cost you can calculate using rep headcount, hourly rates, and time wasted on verification and rework.
- The impact compounds by role: SDRs lose outbound volume, AEs waste time in unqualified deals, and RevOps inherits compounding forecast errors.
- A two-layer model (bottom-up time waste + top-down benchmark) gives you a defensible range for CFO conversations, not just a single scary number.
- GenAI amplifies the cost of dirty data — bad inputs produce confidently wrong outputs, multiplying wasted rep cycles downstream.
- Fixing the data layer produces measurable pipeline gains, not just efficiency improvements — verified contacts mean more meetings booked per sequence.
Why Does Poor Data Quality Cost Sales Teams So Much?
Poor data quality costs sales teams through a combination of direct time waste (verification, rework, re-prospecting) and indirect pipeline leakage (misrouted leads, duplicate outreach, stale contacts). According to Grazitti, Gartner estimates poor data quality costs organizations an average of $12.9 million annually — and sales carries a disproportionate share of that burden because reps interact with contact and account data constantly.
The problem is structural. AgentsForHire reports that 44% of companies lose more than 10% of their annual revenue due to poor CRM data quality affecting sales outreach and pipeline accuracy. That's not an edge case — it's the default state for most growing sales orgs.
Three root causes drive most of the damage:
- Stale contact records: Titles, emails, and phone numbers decay as people change roles.
- Incomplete firmographic data: Reps can't segment or personalize without accurate company attributes.
- Duplicate and misrouted leads: Multiple reps touch the same prospect, burning goodwill and capacity.
Struggling to find qualified leads because your contact data is incomplete? Search Apollo's 230M+ verified contacts with 65+ filters to build lists you can actually act on.
How Do You Build a Two-Layer Cost Model for Sales?
The most defensible approach combines a bottom-up time-waste calculation with a top-down benchmark to produce a cost range rather than a single figure. This gives RevOps leaders the credibility to present findings to finance without overstating.
Layer 1: Bottom-Up (Time Waste Per Rep)
Start with your rep's fully loaded hourly cost and the hours lost to bad data each week.
| Variable | Example Input | How to Find It |
|---|---|---|
| Number of reps | 20 | Headcount report |
| Fully loaded hourly cost | $75/hr | Total comp ÷ 2,080 hours |
| Hours lost to bad data per rep/week | 4 hrs | Time audit or rep survey |
| Annual cost of lost time | $312,000 | Reps × hrs × rate × 50 weeks |
Add pipeline leakage: estimate the number of leads misrouted or stale per month, multiply by your average win rate and average contract value to get pipeline lost to data errors.
Full formula:(Reps × hrs lost/week × hourly rate × 50) + (stale leads/month × 12 × win rate × ACV)
Layer 2: Top-Down (Benchmark Allocation)
Use the Gartner benchmark cited above as an upper bound. Allocate a sales share based on your sales headcount as a percentage of total employees, or by CRM user count.
For a 50-person company where 20 are in sales (40%), your allocated cost floor is a meaningful fraction of the enterprise-wide figure.
Your actual cost likely falls between the bottom-up time calculation and the top-down allocation. Present both to your CFO as a range.
Turn Funnel Guesswork Into Real Pipeline
Pipeline forecasting a guessing game because marketing leads never convert? Apollo surfaces high-intent prospects already primed to buy. Nearly 100K paying customers stopped forecasting blind and started closing.
Start Free with Apollo →How Does Poor Data Quality Affect SDRs, AEs, and RevOps Differently?
Each role absorbs the cost of bad data in a distinct way, and fixing it produces different ROI signals per persona.
| Role | Primary Pain Point | Measurable Impact | Leading Indicator to Track |
|---|---|---|---|
| SDRs/BDRs | Stale emails, wrong titles, undeliverable contacts | Lower connect rate, higher bounce rate, fewer meetings booked | Valid email rate per sequence |
| AEs | Misqualified leads, incomplete account context | More time in deals that won't close, longer sales cycles | Discovery-to-close conversion rate |
| RevOps | Duplicate records, inconsistent fields, routing errors | Forecast inaccuracy, audit time, compounding CRM debt | CRM data completeness score |
For SDRs, the cost is volume. Every bounced email or wrong-number dial is a wasted touch that could have been a booked meeting.
For AEs managing deals, the cost is cycle length — incomplete account data means more time in discovery and more deals that stall. RevOps leaders carry the compounding cost: every bad record creates downstream errors in routing, attribution, and forecasting.
Understanding how data enrichment works is the first step toward recovering those productivity losses at each layer.

How Does GenAI Make the Cost of Dirty Data Worse?
GenAI amplifies the cost of poor data quality by producing confidently wrong outputs from bad inputs. A Forrester 2026 B2B predictions report forecasts more than $10 billion in losses tied to ungoverned AI in B2B sales and marketing, specifically because AI tools are being deployed on top of unvalidated CRM data.
The second-order effect matters for sales teams: AI-generated target lists built from stale records send reps after prospects who've changed roles. AI-personalized emails referencing wrong firmographics damage sender reputation.
AI-scored leads ranked on incomplete data send AEs into deals that fit the model but not the reality.
This means your cost-of-poor-data calculation in 2026 must include an AI error multiplier. If AI tools are touching your prospecting, scoring, or routing workflows, the baseline productivity loss from bad data compounds through every AI-assisted step.
What Are the Quick Wins for Reducing the Cost of Bad Data?
Prioritize fixes that recover the most selling time fastest, mapped to the root causes that drive the largest share of waste.
- Run a CRM completeness audit: Score records by fill rate across key fields (title, direct email, phone, company size, industry). Records below a threshold should trigger enrichment automatically.
- Set a contact decay trigger: Flag records that haven't been updated in 90 days for re-verification before they enter sequences.
- Deduplicate before routing: Merge or suppress duplicates at the point of lead capture, not after reps have already touched them.
- Enrich inbound leads at the moment of conversion: Append firmographic and contact data before leads reach the SDR queue so reps start with complete context.
- Establish a data governance owner in RevOps: Assign clear ownership for data standards, enrichment schedules, and quality scoring.
For a structured approach, see how to build a data enrichment strategy that maps to your sales workflow. You can also explore data enrichment vs. data cleansing to understand which approach addresses which category of cost.
Tired of dirty data slowing your pipeline? Start free with Apollo's verified contact enrichment and stop wasting rep time on records that don't convert.
How Do You Present the ROI of Fixing Data Quality to a CFO?
Present the ROI of fixing data quality as a range with three components: time recovered, pipeline recovered, and AI risk mitigated. Each maps to a line item your CFO already tracks.
- Time recovered: Use your bottom-up calculation. Convert rep hours saved into quota-carrying capacity (hours freed × activity rate × conversion benchmarks).
- Pipeline recovered: Estimate the lift in lead-to-meeting conversion when contacts are verified. Even a small improvement in connect rate produces measurable pipeline at scale.
- Risk mitigated: Use the top-down benchmark as a ceiling. Reference the Forrester AI-loss projection as context for why the cost grows if ungoverned AI is layered onto bad data.
According to Revefi, over 25% of data and analytics employees estimate losses exceeding $5 million annually due to poor data quality, with 7% reporting losses of $25 million or more. Anchoring your internal model against these distributions gives your CFO peer-validated context for the ask.
For more on connecting data investments to revenue outcomes, see how contact data enrichment drives ROI and how to calculate return on sales with industry benchmarks.

Start Measuring — Then Start Fixing
The cost of poor data quality on sales productivity is calculable, defensible, and fixable. The two-layer model gives you a range for your CFO.
The role-by-role breakdown gives you a prioritization framework. And the quick-win roadmap gives your RevOps team a starting point that doesn't require a multi-quarter project.
The teams that win in 2026 are the ones who treat contact and account data as a revenue asset — not a maintenance task. High performers already prioritize data hygiene over underperformers, and that gap widens as AI tools scale the consequences of every bad record.
Apollo consolidates prospecting, enrichment, sequencing, and pipeline management in one platform — so your data quality investments directly translate into rep productivity. "Having everything in one system was a game changer" — Cyera. Ready to stop paying the hidden tax of bad data? Get Leads Now.
Prove Pipeline ROI With Apollo
ROI pressure killing your next budget approval? Apollo surfaces measurable pipeline impact from day one — no slow pilots, no guesswork. Teams like Leadium 3x'd revenue. See your ROI fast.
Start Free with Apollo →Don't miss these
Sales
Inbound vs Outbound Marketing: Which Strategy Wins?
Sales
What Is a Sales Funnel? The Non-Linear Revenue Framework for 2026
Sales
What Is a Go-to-Market Strategy? The 2026 GTM Playbook
See Apollo in action
We'd love to show how Apollo can help you sell better.
By submitting this form, you will receive information, tips, and promotions from Apollo. To learn more, see our Privacy Statement.
4.7/5 based on 9,015 reviews
