
What Is SOV in Marketing? Share of Voice Strategy for B2B Growth
Share of Voice (SOV) measures your brand's visibility in market conversations compared to competitors. In 2026, SOV has evolved beyond traditional ad spend tracking to become a critical metric for B2B teams navigating tighter budgets and rep-free buying journeys. According to Talkwalker, SOV measures a brand's dominance in market conversations compared to competitors, reflecting its visibility and influence across digital channels.
With 69% of the B2B purchase process happening before buyers engage sellers, winning SOV early determines which vendors make the shortlist. This guide shows you how to measure, optimize, and convert SOV into pipeline growth using budget-aware strategies and proven frameworks.
Apollo Finds Verified Contacts In Seconds
Tired of spending 4+ hours daily hunting for contact info? Apollo delivers 224M verified contacts with 96% email accuracy. Join 550K+ companies who eliminated manual research.
Start Free with Apollo →Key Takeaways
- SOV measures your share of category visibility (spend, mentions, search, social) versus competitors
- Extra Share of Voice (ESOV) drives market share gains: Research from Riff Analytics shows that for every 10 percentage points a brand's Share of Voice exceeds its Share of Market (ESOV), it typically gains approximately 0.5% in market share annually
- B2B SOV matters most in pre-sales phases where 81% of buyers choose vendors before sales contact
- Digital SOV proxies (search visibility, social share, PR mentions) now dominate measurement as digital spend hits 61.1% of marketing budgets
- Sales and marketing alignment amplifies SOV impact: Brainstorm Club reports organizations with strong sales and marketing alignment achieve 208% higher marketing revenue
What Is Share of Voice in Marketing?
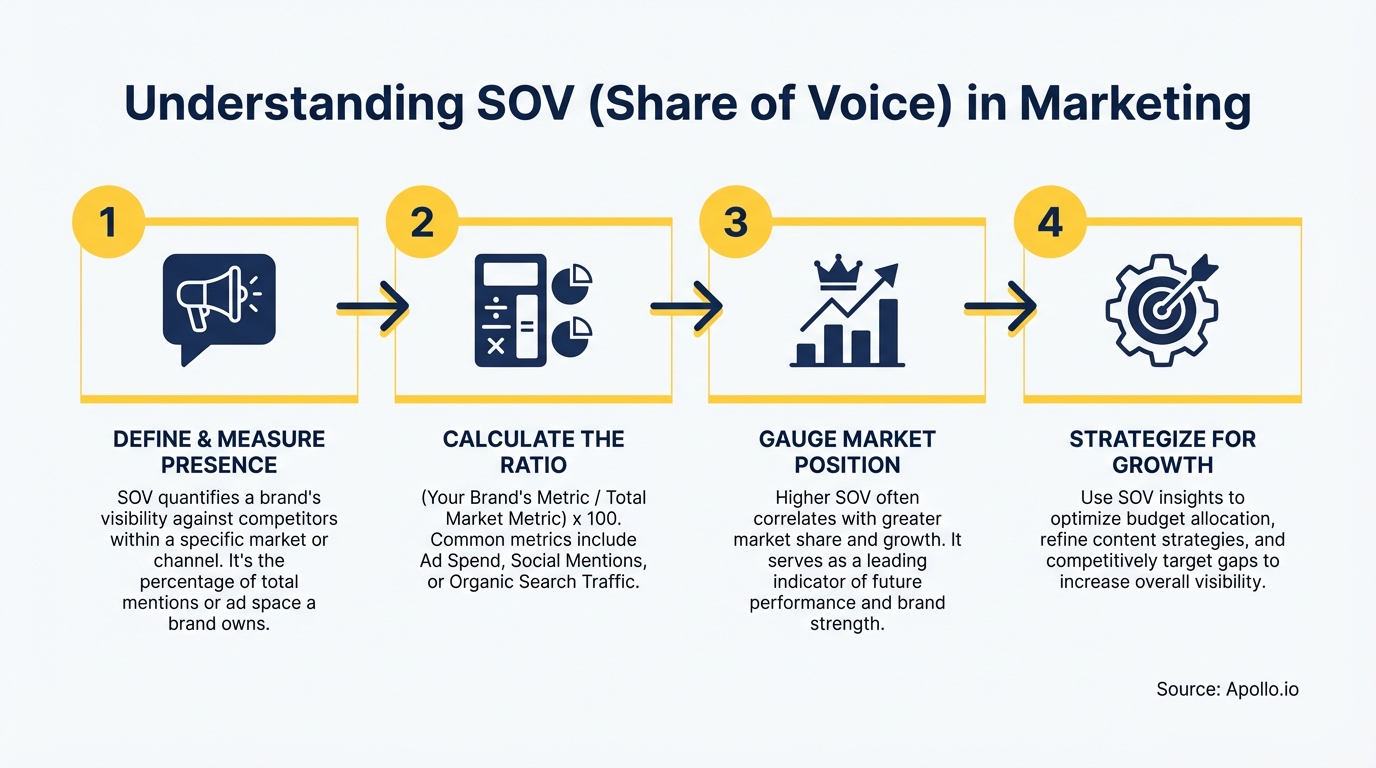
Share of Voice (SOV) represents your brand's percentage of total market visibility within a category, channel, or timeframe. Originally a media spend metric (your ad spend divided by total category ad spend), SOV now encompasses digital presence across search, social, PR, and earned media.
SOV answers: "Out of all the noise in our category, what percentage belongs to us?" A brand with 30% SOV captures 30 of every 100 impressions, mentions, or dollars spent in that space. The metric matters because visibility precedes consideration, especially in B2B where buyers complete two-thirds of their research independently.
Traditional SOV vs. Digital SOV Proxies
| Metric Type | Measurement Method | Best Use Case |
|---|---|---|
| Traditional SOV | Ad spend as % of category spend | Paid media budget allocation |
| Search SOV | Impression share for target keywords | Organic and paid search visibility |
| Social SOV | Mentions, shares, engagement vs. competitors | Brand awareness and sentiment tracking |
| PR/Earned SOV | Media coverage volume and reach | Thought leadership and credibility |
"Apollo could be a third of the cost if you look at the full price of what we were spending on ZoomInfo, Outreach, Salesforce, and admins to make it all work."
How to Calculate SOV and ESOV for Budget-Aware Teams
Calculate SOV using this formula: Your Brand Metric ÷ Total Category Metric × 100. For paid search, divide your impression share by total available impressions.
For social, divide your mention volume by total category mentions. The key is defining your competitive set and measurement window consistently.
Extra Share of Voice (ESOV) reveals growth potential: ESOV = SOV - Share of Market (SOM). If you hold 25% SOV but only 15% market share, your ESOV is +10 points. This signals investment efficiency and future growth trajectory. However, Britopian notes that while a high SOV can be impressive, it doesn't always reflect actual business impact or audience engagement without considering context like message quality and sentiment.
Budget-Aligned SOV Target Setting
- Underfunded brands (SOM > SOV): Prioritize high-intent channels (search, review sites, analyst relations) where smaller budgets drive qualified pipeline
- Growth-stage brands (SOV ≈ SOM): Maintain current SOV while improving message quality and conversion rates
- Market leaders (SOV > SOM): Defend position with category-building content and thought leadership
Need verified contact data to fuel your SOV strategy? Access Apollo's database of 224M+ verified contacts to identify and reach decision-makers before competitors do.
Fill Your Funnel With Sales-Ready Prospects
Struggling with low lead-to-opportunity conversion? Apollo identifies your exact buyers with 96% email accuracy and intent signals. Built-In increased win rates 10% using Apollo's scoring.
Start Free with Apollo →Why SOV Matters for B2B Pre-Sales and Shortlist Influence
B2B buyers complete 69% of their purchase journey before engaging sales reps. By the time your AE gets on a call, 81% of buyers have already chosen a preferred vendor.
SOV determines whether your brand enters that early consideration set or gets filtered out before you know the opportunity exists.
Winning SOV in pre-sales channels (search, social, analyst reports, peer review sites) puts you on the Day One shortlist. Losing SOV means fighting uphill battles against vendors who've already built trust and captured mindshare.
In compressed buying cycles (now averaging 10.1 months, down from 11.3), you have fewer touchpoints to build presence.
High-Impact SOV Channels for B2B Shortlist Building
- Organic search: Own problem-aware and solution-aware queries where buyers research independently
- Peer review sites: Dominate G2, Capterra, TrustRadius with volume, recency, and sentiment
- Social proof: Build consistent presence where your ICP congregates (not just where everyone posts)
- Analyst relations: Secure inclusion in category reports and vendor evaluations
- Community engagement: Show up in Slack communities, forums, and professional networks where buyers ask for recommendations
For teams exploring how to structure their B2B marketing efforts around SOV and revenue metrics, aligning SOV goals with pipeline contribution ensures investment flows to channels that drive qualified opportunities.
"The thing that made me most excited as somebody who's been in sales development a long time was Apollo's integration between sales data and sales engagement and the magic that you can make happen when those two are together on the same platform."
Channel-Specific SOV Measurement Framework
Effective SOV tracking requires channel-specific metrics and tools. Use this framework to measure SOV across your marketing mix without overspending on redundant analytics platforms.
| Channel | Primary SOV Metric | Measurement Tool |
|---|---|---|
| Paid Search | Impression share % | Google Ads, Microsoft Ads |
| Organic Search | Visibility score for target keywords | Semrush, Ahrefs, Moz |
| Social Media | Mention volume and engagement share | Brandwatch, Sprout Social |
| PR/Earned Media | Coverage volume and reach | Meltwater, Cision |
| Review Sites | Review volume and rating distribution | G2, Capterra native analytics |
Track SOV monthly for fast-moving categories, quarterly for stable markets. Compare your SOV trend against market share movement to validate ESOV's predictive power.
If SOV rises but market share stalls, investigate message quality, conversion rates, and sales follow-through.

Common SOV Measurement Challenges and Solutions
Most SOV measurement fails due to inconsistent competitive sets, mismatched timeframes, or ignoring sentiment context. Define your competitive set based on buyer consideration (who appears in deals you win and lose), not just category proximity.
Lock this set for at least two quarters to enable trend analysis.
Sentiment weighting prevents false positives where high mention volume comes from negative coverage. Weight mentions by sentiment score (positive = 1.0, neutral = 0.5, negative = 0 or -0.5) before calculating SOV.
A brand with 1,000 neutral mentions may have lower effective SOV than a competitor with 600 positive mentions.
Attribution complexity increases as buyers touch multiple channels before converting. Use first-touch attribution for SOV's awareness impact, multi-touch for full-funnel contribution. Tools like modern B2B marketing platforms now offer unified tracking across paid, organic, and social channels.
Implementing SOV Optimization: 90-Day Roadmap
Start with a focused SOV program targeting your highest-intent channels. Most teams try to win everywhere and end up winning nowhere. Pick 2-3 channels where your ICP actively researches solutions.
Weeks 1-4: Foundation and Baseline
- Define competitive set (5-7 direct competitors)
- Establish baseline SOV across paid search, organic search, and one social channel
- Calculate current ESOV (SOV minus market share)
- Identify SOV gaps where competitors dominate high-intent queries
Weeks 5-8: Quick Wins and Content Gaps
- Launch campaigns targeting competitor SOV weaknesses
- Publish content for problem-aware searches where you're absent
- Increase review site presence (solicit reviews, respond to existing feedback)
- Set up automated SOV dashboards for weekly tracking
Weeks 9-12: Optimization and Scale
- Double down on channels showing positive ESOV-to-pipeline correlation
- Test message variants to improve sentiment scores
- Expand competitive set if market dynamics shift
- Connect SOV metrics to revenue outcomes in your CRM
Looking to accelerate your outreach while building SOV? Automate your multi-channel sequences with Apollo to maintain consistent presence across email, phone, and social touchpoints.
Connecting SOV to Revenue: The Sales-Marketing Alignment Imperative
SOV gains mean nothing if sales can't convert the awareness you've built. Yet Influ2 reports a significant 53% of organizations experience hand-off misalignment between marketing and sales. This gap kills SOV's revenue potential.
Align SOV investment with sales priorities by mapping high-SOV channels to deal velocity and win rates. If your paid search SOV drives 40% of SQLs but only 15% convert to closed-won, investigate message-market fit or lead qualification criteria.
SOV should predict pipeline, not just awareness.
RevOps teams play a critical role here. CoreFactors notes that by 2025, 75% of the highest-growth companies are expected to have implemented a RevOps model to accelerate growth. RevOps connects SOV metrics to revenue systems, ensuring marketing's visibility gains translate to sales opportunities.
Conclusion: Turn SOV Into Pipeline With Data-Driven Execution
Share of Voice matters because buyers choose vendors before your sales team knows they're in-market. In 2026's budget-constrained environment, winning SOV efficiently requires channel prioritization, sentiment-weighted measurement, and tight sales-marketing alignment.
Start with baseline SOV measurement across 2-3 high-intent channels. Calculate your ESOV to understand growth potential.
Focus content and campaigns on pre-sales touchpoints where your ICP researches independently. Track SOV's correlation to pipeline and revenue, not just vanity metrics.
The brands winning market share in 2026 aren't outspending competitors. They're winning the right conversations in the right channels at the right time.
That's what SOV optimization delivers when executed with budget discipline and revenue focus.
Ready to build a go-to-market engine that turns visibility into revenue? Try Apollo Free to access the data, engagement tools, and AI automation that power efficient SOV strategies for teams at every stage.
Prove ROI In Days, Not Quarters With Apollo
Budget approval stuck on unclear metrics? Apollo delivers measurable pipeline impact from day one—quantifiable meetings booked, opportunities created, deals closed. Built-In increased win rates 10% and ACV 10% using Apollo's scoring.
Start Free with Apollo →Don't miss these
Sales
Inbound vs Outbound Marketing: Which Strategy Wins?
Sales
What Is a Sales Funnel? The Non-Linear Revenue Framework for 2026
Sales
What Is a Go-to-Market Strategy? The 2026 GTM Playbook
See Apollo in action
We'd love to show how Apollo can help you sell better.
By submitting this form, you will receive information, tips, and promotions from Apollo. To learn more, see our Privacy Statement.
4.7/5 based on 9,015 reviews
