
What Is the Difference Between Revenue vs Sales in 2026?
Revenue and sales are often used interchangeably, but understanding their distinctions can transform how you track performance, forecast growth, and optimize your go-to-market strategy. For B2B sales teams, this clarity impacts everything from commission structures to investor reporting. According to B2BEA, B2B manufacturers and distributors in the U.S. grew their combined sales to $14.89 trillion in 2022, a 15.4% increase from the previous year. Yet many sales leaders still struggle to separate sales metrics from total revenue calculations.
Apollo Turns Research Hours Into Selling Time
Tired of spending 4+ hours daily hunting for contact info? Apollo delivers 224M verified contacts with 96% email accuracy instantly. Join 550K+ companies who eliminated manual research.
Start Free with Apollo →Key Takeaways
- Sales refers to income from core product or service offerings, while revenue includes all income sources including interest, investments, and other streams
- For B2B companies, tracking both metrics separately provides clearer pipeline visibility and more accurate forecasting
- RevOps teams using unified platforms can reduce reporting complexity and gain real-time visibility into both sales and total revenue performance
- In 2026, AI-powered analytics help sales leaders attribute revenue to specific activities, improving decision-making and resource allocation
What Is the Core Difference Between Revenue and Sales?
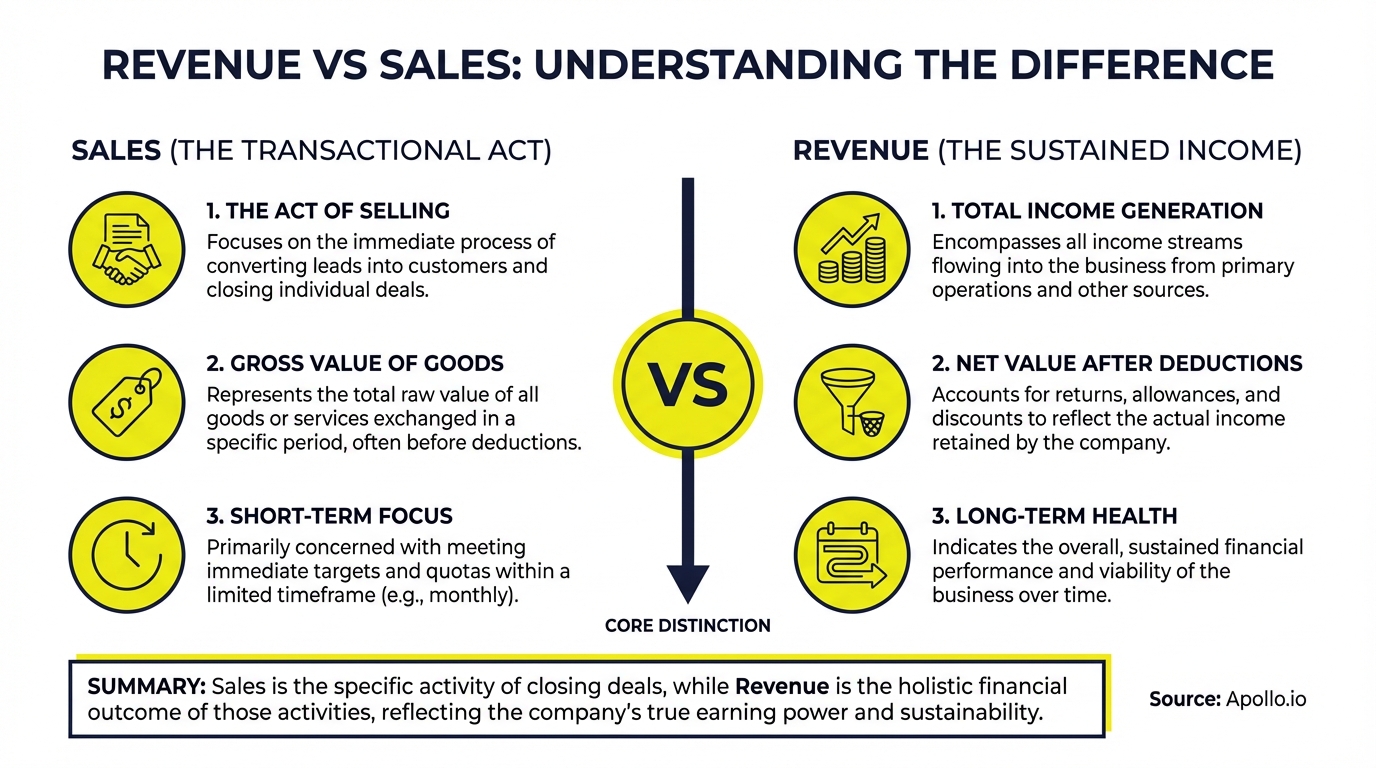
Sales represents the income generated specifically from selling products or services to customers. Revenue encompasses all money flowing into a business, including sales plus additional income from investments, interest, royalties, and other non-sales sources.
For most B2B companies, sales constitute the majority of revenue. However, the distinction matters for accurate financial reporting and strategic planning.
A SaaS company might generate $10M in sales from subscriptions but report $10.5M in total revenue after including interest income and partnership fees.
| Metric | Definition | Example Sources |
|---|---|---|
| Sales | Income from core offerings | Product sales, service contracts, subscriptions |
| Revenue | All income sources | Sales + interest + investments + royalties |
Research by CMO Survey shows that B2B product companies reported average revenue growth of 19.2% in 2024, while services companies saw 18.9% increases. Understanding which portion comes from direct sales versus other channels helps leaders allocate resources effectively.
Why Do Sales Leaders Need to Track Both Metrics?
Tracking both sales and total revenue provides a complete picture of business health and growth sustainability. Sales metrics show how well your core offerings perform, while revenue reveals overall financial strength.
For Account Executives managing complex enterprise deals, this distinction affects quota attainment and commission structures. If your compensation ties to sales but leadership reports on total revenue, misalignment creates confusion and missed targets.
Critical tracking differences:
- Sales forecasting focuses on pipeline and deal velocity
- Revenue forecasting includes recurring income and non-sales streams
- Sales quotas measure individual and team performance
- Revenue targets guide overall company growth and investor expectations
Struggling to connect sales activities to revenue outcomes? Track every deal stage with Apollo's pipeline visibility and real-time revenue attribution.
How Do SDRs and AEs Impact Sales vs Revenue Differently?
SDRs (Sales Development Representatives) primarily influence the sales pipeline by qualifying leads and booking meetings. Their activities directly impact future sales but may not immediately affect current revenue.
AEs (Account Executives) close deals that generate immediate sales and contribute to quarterly revenue targets.
For SDRs using proven outbound strategies, success metrics focus on meetings booked, qualified opportunities created, and pipeline value generated. These leading indicators predict future sales. AEs measure closed-won deals, contract values, and revenue recognized within specific periods.

| Role | Primary Sales Impact | Revenue Impact Timeline |
|---|---|---|
| SDR | Pipeline generation, lead qualification | 30-90 days (future revenue) |
| AE | Deal closure, contract negotiation | Immediate (current quarter revenue) |
| RevOps | Process optimization, data accuracy | Ongoing (efficiency gains) |
Modern sales teams consolidate their tech stack to track both metrics in one workspace. As one Apollo customer from Predictable Revenue shared: "We reduced the complexity of three tools into one," enabling clearer visibility across the entire revenue cycle.
Apollo Turns Forecasting Chaos Into Clarity
Pipeline forecasting a guessing game? Apollo delivers real-time deal visibility across every stage. Built-In boosted win rates 10% with Apollo's scoring and signals.
Start Free with Apollo →What Revenue Streams Exist Beyond Direct Sales?
Beyond core sales, B2B companies generate revenue from multiple streams including recurring subscriptions, professional services, partner referral fees, interest income, and licensing agreements. Each stream requires different tracking and forecasting methods.
Common B2B revenue streams in 2026:

- Subscription revenue: Monthly or annual recurring charges (ARR/MRR)
- Professional services: Implementation, training, consulting fees
- Usage-based revenue: Charges tied to consumption or API calls
- Partnership income: Referral fees, co-selling arrangements
- Investment returns: Interest, dividends, capital gains
Data from B2BEA indicates digital sales on B2B e-commerce platforms grew 17% in 2023, rising from $1.95 trillion to $2.1 trillion. This shift toward digital channels creates new revenue attribution challenges for sales leaders.
How Can RevOps Teams Optimize Revenue vs Sales Tracking?
RevOps leaders optimize tracking by implementing unified data systems, standardizing definitions across teams, and automating revenue attribution. The goal is eliminating manual reporting and giving stakeholders real-time visibility.
Start by defining clear metrics for both sales and revenue in your CRM. Create separate dashboards for sales performance (pipeline, win rates, deal velocity) and total revenue (all income sources, growth rates, forecasts). Use analytics tools that connect activities to outcomes.
RevOps optimization checklist:
- Standardize sales stages and revenue recognition rules
- Automate data enrichment to maintain contact and account accuracy
- Build attribution models linking marketing and sales activities to revenue
- Create role-specific dashboards for SDRs, AEs, and executives
- Consolidate tools to reduce data silos and integration complexity
Need a single source of truth for sales and revenue data? Unify your go-to-market operations with Apollo's all-in-one platform. Apollo customers report cutting costs in half by consolidating multiple tools into one workspace.
What Are Common Mistakes in Revenue vs Sales Reporting?
The most common mistake is conflating sales and revenue in forecasts, leading to inaccurate projections and missed targets. Teams also frequently fail to account for revenue timing differences, recognition rules, and non-sales income sources.
Reporting mistakes to avoid:
- Using "sales" and "revenue" interchangeably in executive reports
- Ignoring deferred revenue from multi-year contracts
- Failing to separate one-time sales from recurring revenue streams
- Not aligning sales quotas with actual revenue recognition timing
- Relying on disconnected systems that create data inconsistencies
For Founders and CEOs building scalable revenue engines, precision matters. Investors scrutinize revenue composition, growth rates, and sustainability.
Presenting inflated numbers by confusing sales bookings with recognized revenue damages credibility and valuation.
Conclusion: Master Revenue vs Sales for Smarter Growth in 2026
Understanding the distinction between revenue and sales isn't academic. It shapes how you forecast, compensate teams, and communicate with investors.
Sales measures your core offering's market performance. Revenue captures your complete financial picture.
Modern B2B teams need unified platforms that track both metrics without manual reporting overhead. By consolidating prospecting, engagement, pipeline management, and analytics into one system, you gain the visibility required for data-driven decisions.
Sales leaders at companies like Cyera report: "Having everything in one system was a game changer."
In 2026, the most successful teams leverage AI-powered automation to connect every sales activity to revenue outcomes. They eliminate tech stack complexity, reduce costs, and accelerate growth with platforms designed for the complete revenue cycle.
Ready to unify your sales and revenue operations? Start a Trial and join 2M+ users building predictable revenue with Apollo's all-in-one platform.
Prove Apollo's ROI In Your First 30 Days
Budget approval stuck on unclear metrics? Apollo tracks every touchpoint from first contact to closed deal. Built-In increased win rates 10% and ACV 10% with measurable pipeline impact.
Start Free with Apollo →Don't miss these
Sales
Inbound vs Outbound Marketing: Which Strategy Wins?
Sales
What Is a Sales Funnel? The Non-Linear Revenue Framework for 2026
Sales
What Is a Go-to-Market Strategy? The 2026 GTM Playbook
See Apollo in action
We'd love to show how Apollo can help you sell better.
By submitting this form, you will receive information, tips, and promotions from Apollo. To learn more, see our Privacy Statement.
4.7/5 based on 9,015 reviews
